A Giant Map drawn with a Pen
10 Jan 2021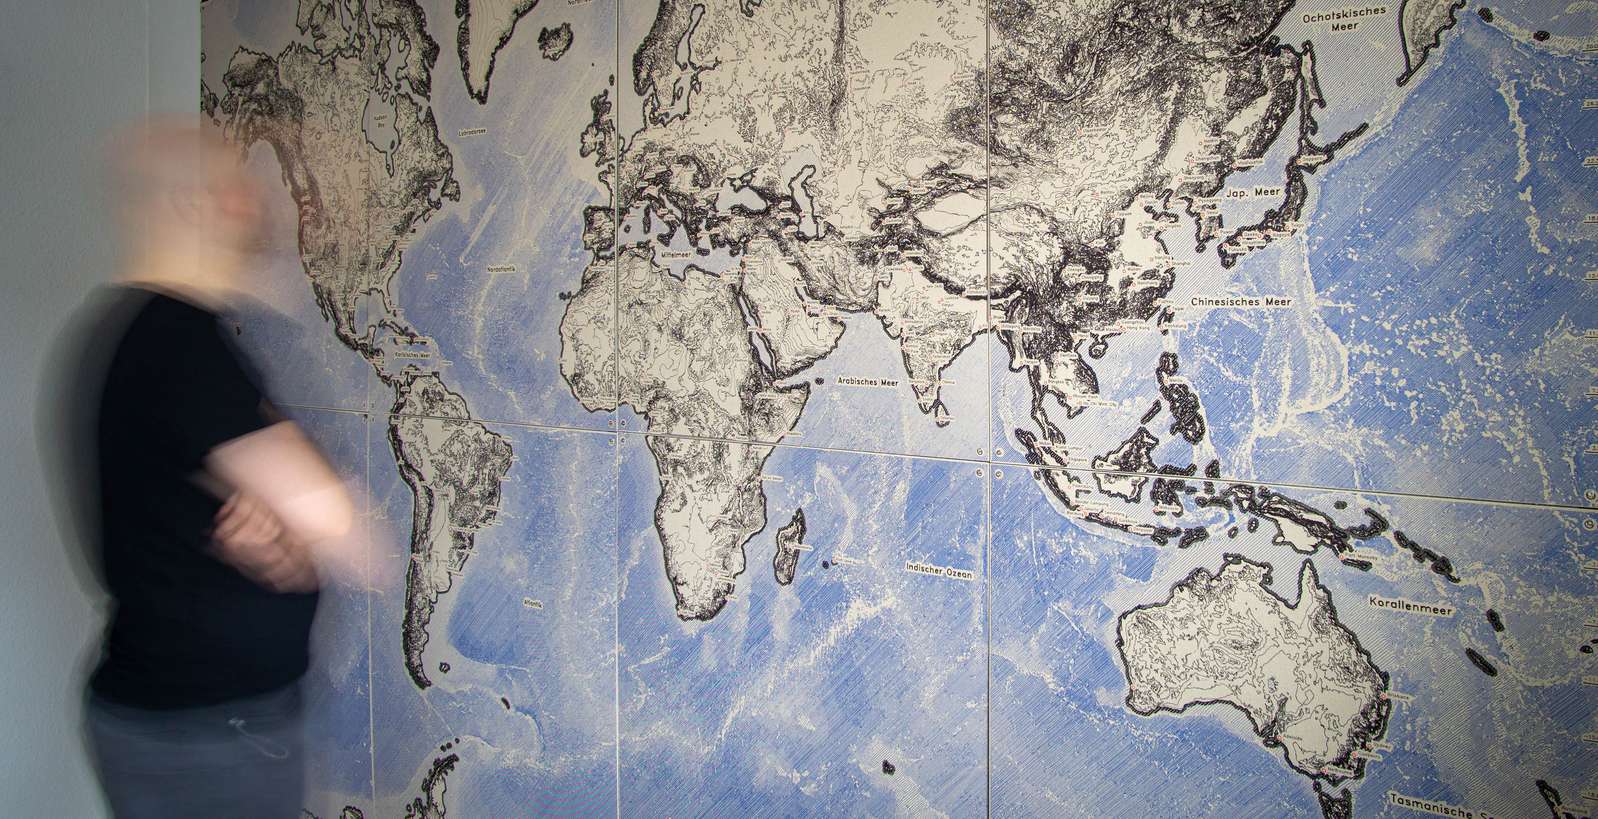
For quite some time I entertained the thought of having a wall-sized world map. Maybe it started when I read the blog post by Dominik Schwarz about his map, maybe a bit earlier. Exactly as Dominik I soon realized it’s really hard to buy a map which is neither ugly nor has a low resolution/amount of details.
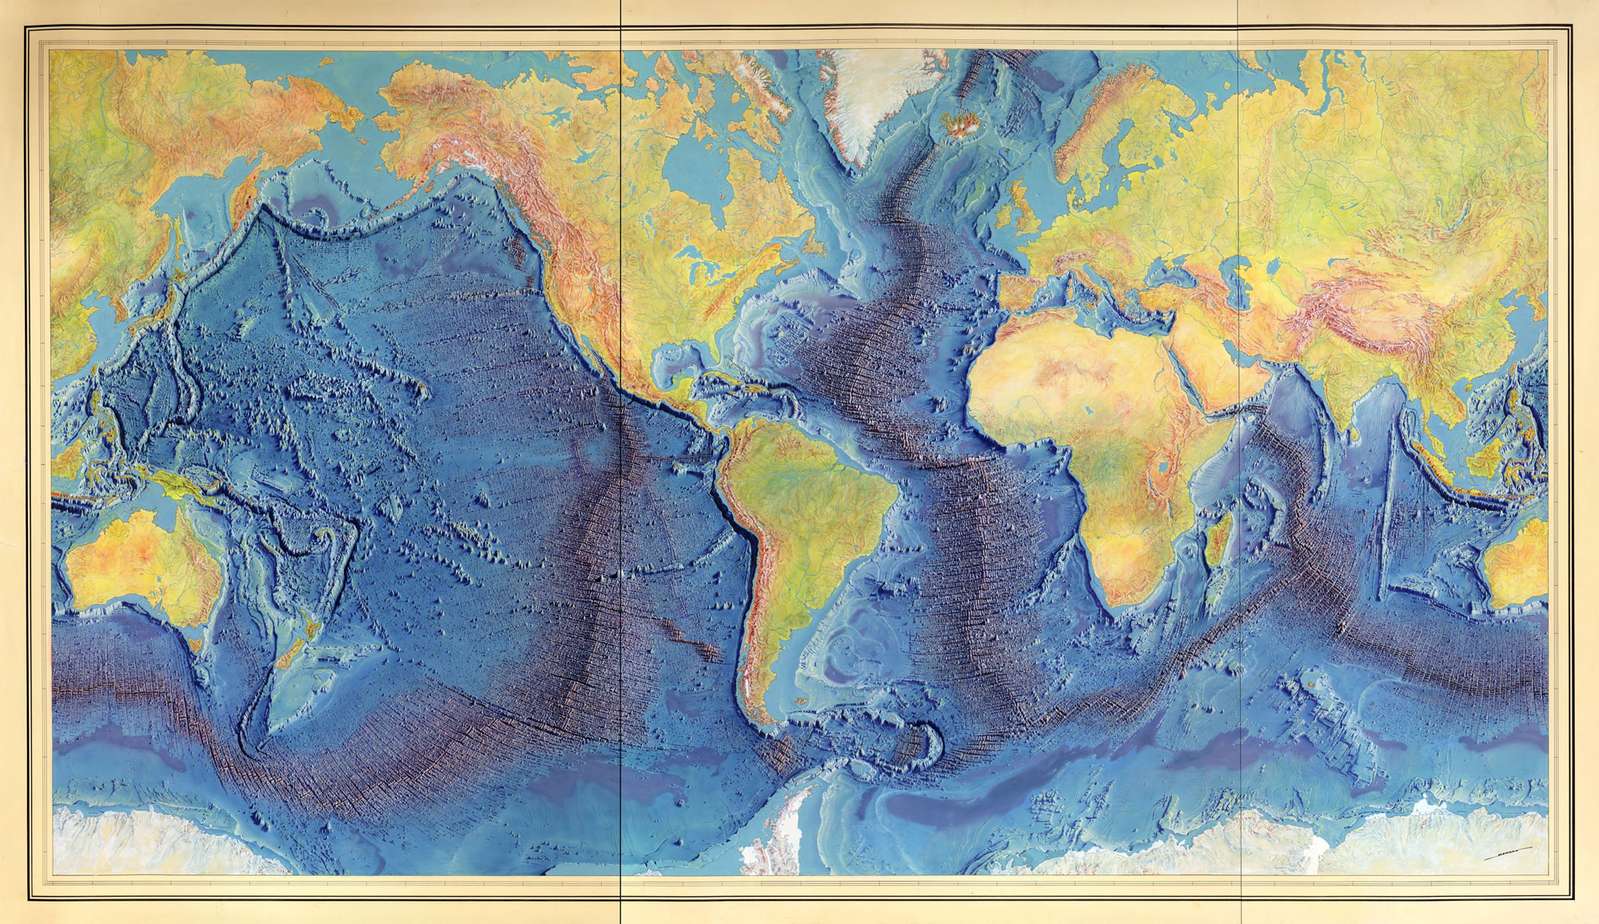
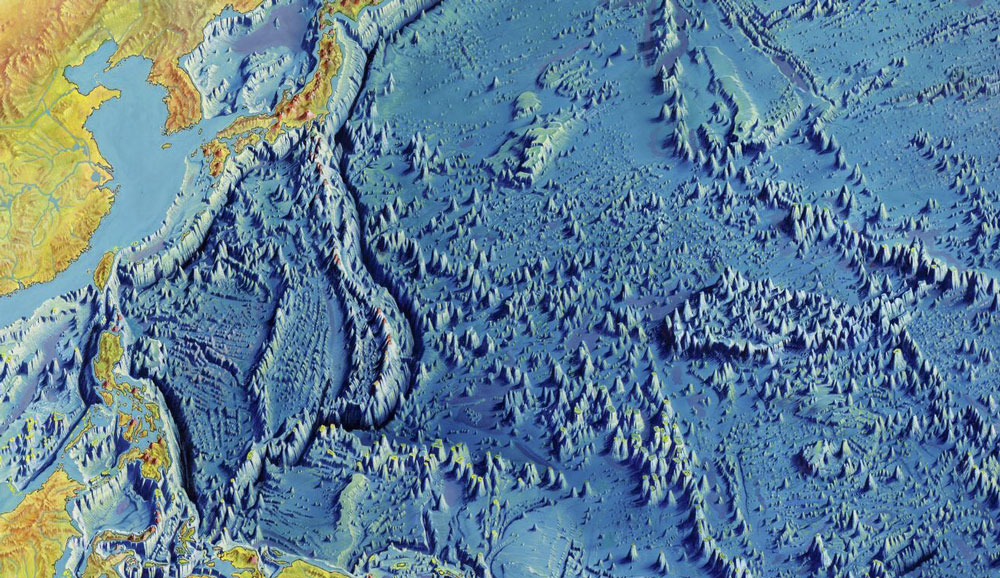
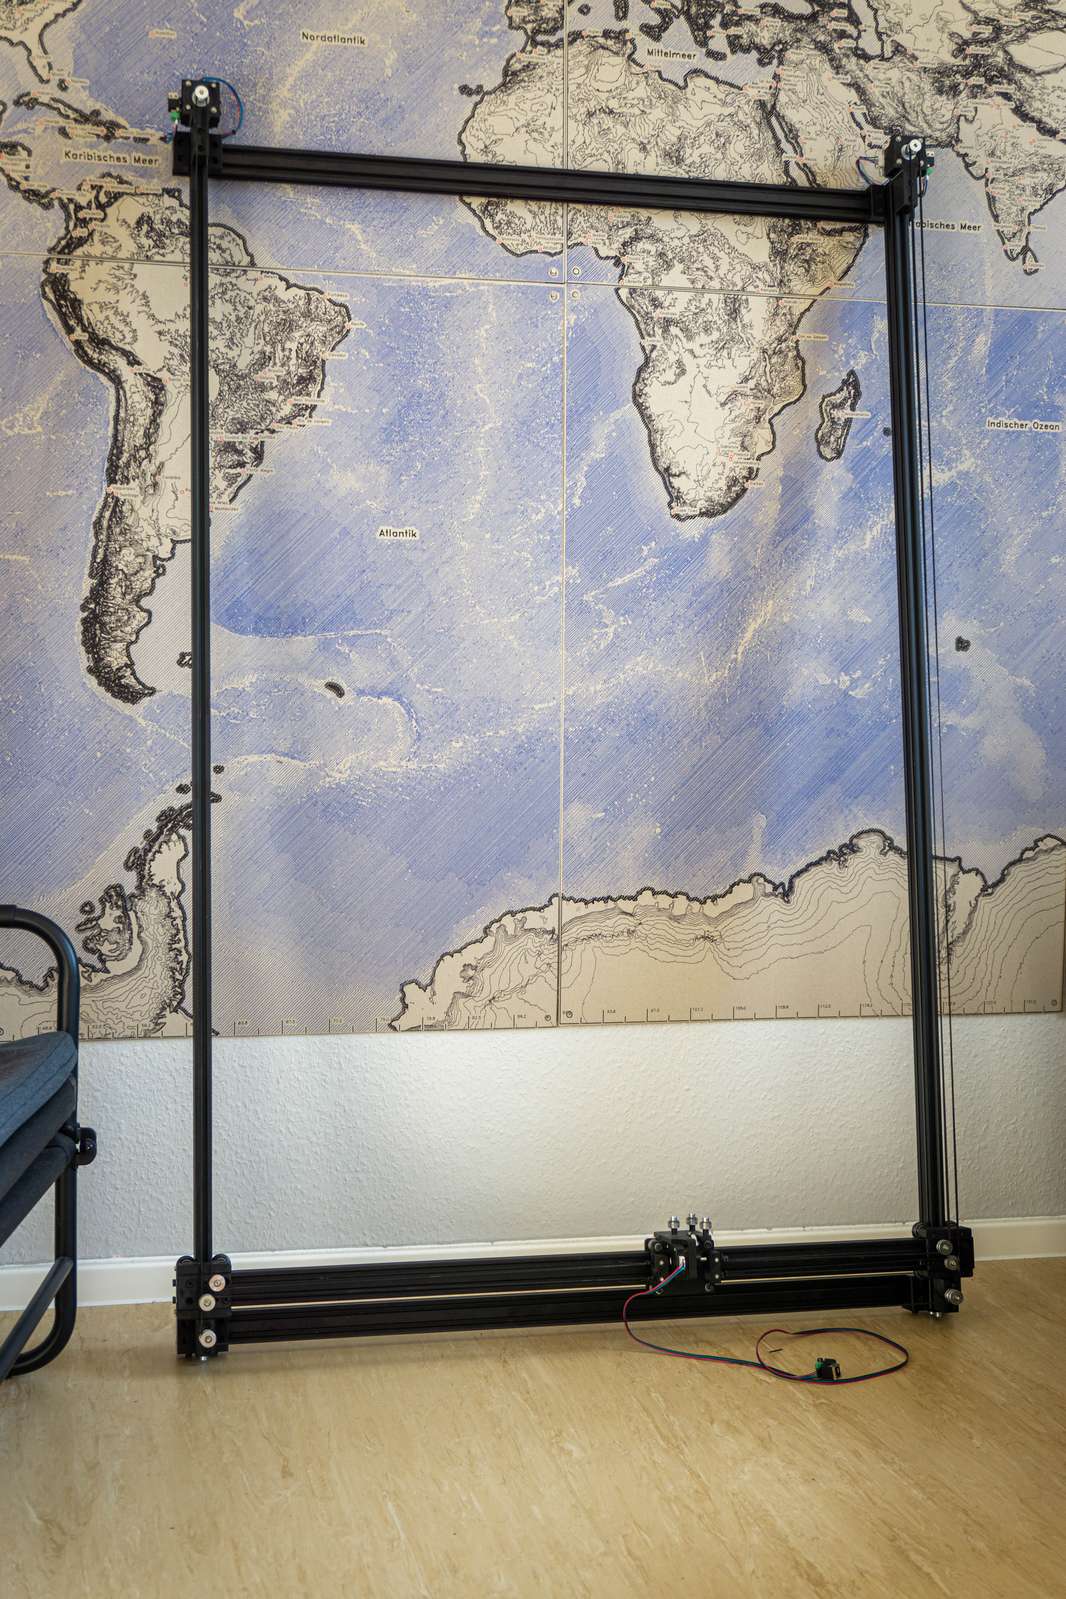
There are a few maps I enjoy visually and probably on the top of the list is the bathymetry map of Heezen and Tharp, drawn by Heinrich Berann. While the sea floor depth data itself is accurate and this is meant to be a scientific documentation, the map and its status as an art object benefits a lot from the artists execution.
.jpg)
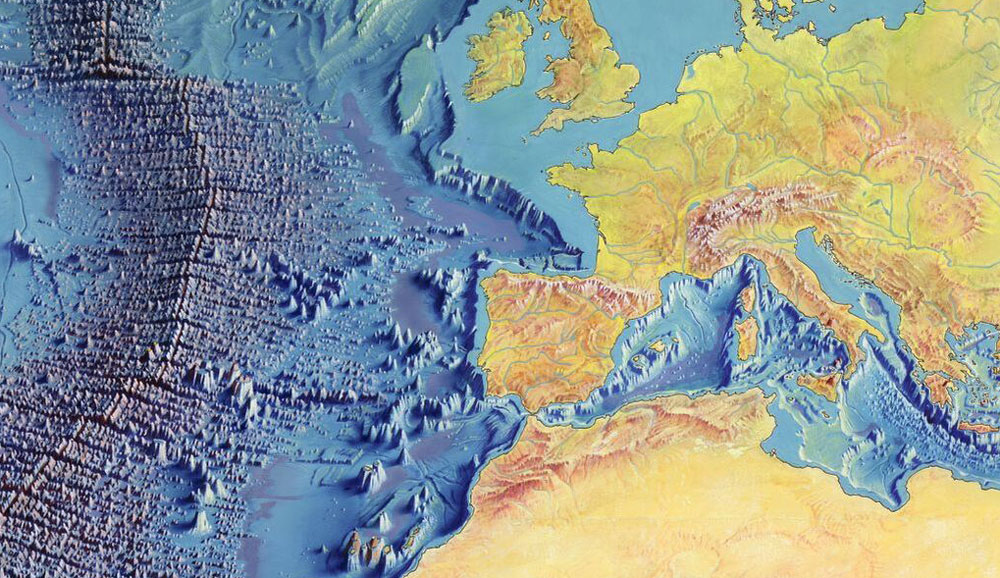
However, the process of getting from information to image involves in this case a manual artistic process. This is especially visible when having a look at the continental shelf.
I for one would prefer something a bit more automatic, after all I am not a professional illustrator. Like all things in life, something is considerably more complicated the closer you look at it and this is true for the process of turning geo-info into a map at a certain zoom-level. Here is a nice blog post reflecting on how much better Google Maps handles all these intricate details compared to other map software.
I experimented a bit with different map data sources, thought about inkjet printing and wrote a script to scrape google maps tiles and stitch them. That works kinda okay-ish, but the the classic Google Maps style did not really fit. For OpenStreetMaps you can find different map styles, the most beautiful (at least in my opinion) of those is Stamens Toner.
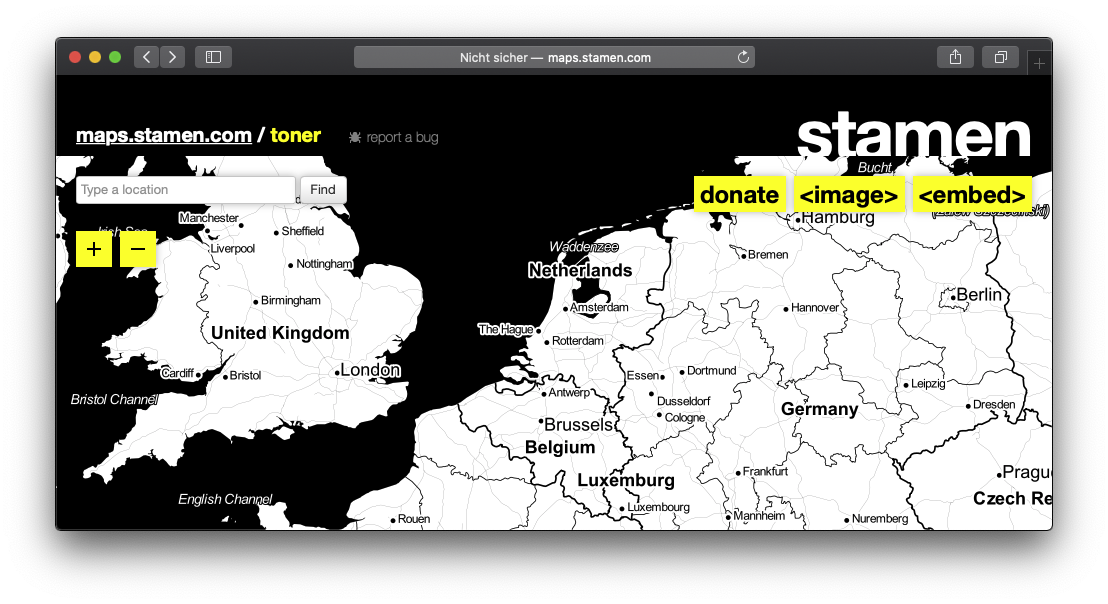
But using either google maps or Stamen’s Toner OSM tiles, this would basically result in me trying to print the largest image possible. But maybe Inkjet printing is not the best way to move forward. So, given our means of production how can we get a really large wall-sized world map? I did built some drawing machines (pen plotters) in the past, so why not do that?…
Data:
First step: how to get the data? Best data source is OpenStreetMap. No discussions. However, a dump from the OSM DB (the planet-file) is a whopping 50GB (compressed) and 1200GB uncompressed! Whew… No. Luckily, there are already pre-processed extracts for certain features and that’s all we need. Namely the land- and water-polygons, the coastline, a selection of cities including meta-data (population) and … the ocean floor depth. Luckily one doesn’t need to scrape Digital Terrain Model data by hand, but can rely on GEBCO.
On a glance:
- Coastlines from OpenStreetMap
- Land and water polygons are shapefiles from Natural Earth
- Bathymetry (ocean depth) from GEBCO
Main problem: when working with pen plotters, we don’t deposit tiny droplets of ink based on pixel data, but draw lines with pens, based on vector data described as coordinates. So our whole image is basically just a gigantic assortements of lines. Drawing maps with pixels has one huge advantage: you can overwrite pixels. You draw the oceans, on top of that the land, on top of the land the streets, etc. When using pens and lines, you see if there is a line underneath the line underneath another line.
So when processing each polygon on each layer needs to be subtracted from all underlaying layers, repaired, simplified and written to an SVG file. That took me a while to figure out. Luckily there is Shapely, an incredibly well working python library for polygons. After creating a map, all the lines need to be sent to the pen-plotter in a order that makes sense. Drawing with the pen is quite fast, but lifting the pen to move to the start of the next line is extremly slow compared to drawing. So main objective is to optimize the pen’s path to minimize pen lifting movements and the travel distance in-between lines.
Luckily, a long time ago, when starting to study computer science there is usually a course like “Introduction to Algorithms and Data Structures” (which almost all freshmen hate).
The problem of “walking” along a certain set of streets in between cities (line start and end points) while taking the shortest route is the Chinese Postman Problem.
So what’s the minimum number of edges that need to be added to graph to traverse the graph on the shortest route while visiting every node exactly once? Yeah, now do that for two million nodes…
Ok, it worked well for smaller graphs but in the end it was very little fun to optimize my crude implementation of an algorithm solving this problem and I dropped it.
The greedy approach, however, did work well: draw a line, check which line’s start or endpoint is closest to the current position and draw that line. That seemed to be about 10 percent slower than the almost optimal solution, but heck, I just want to have something working well enough to get it done.
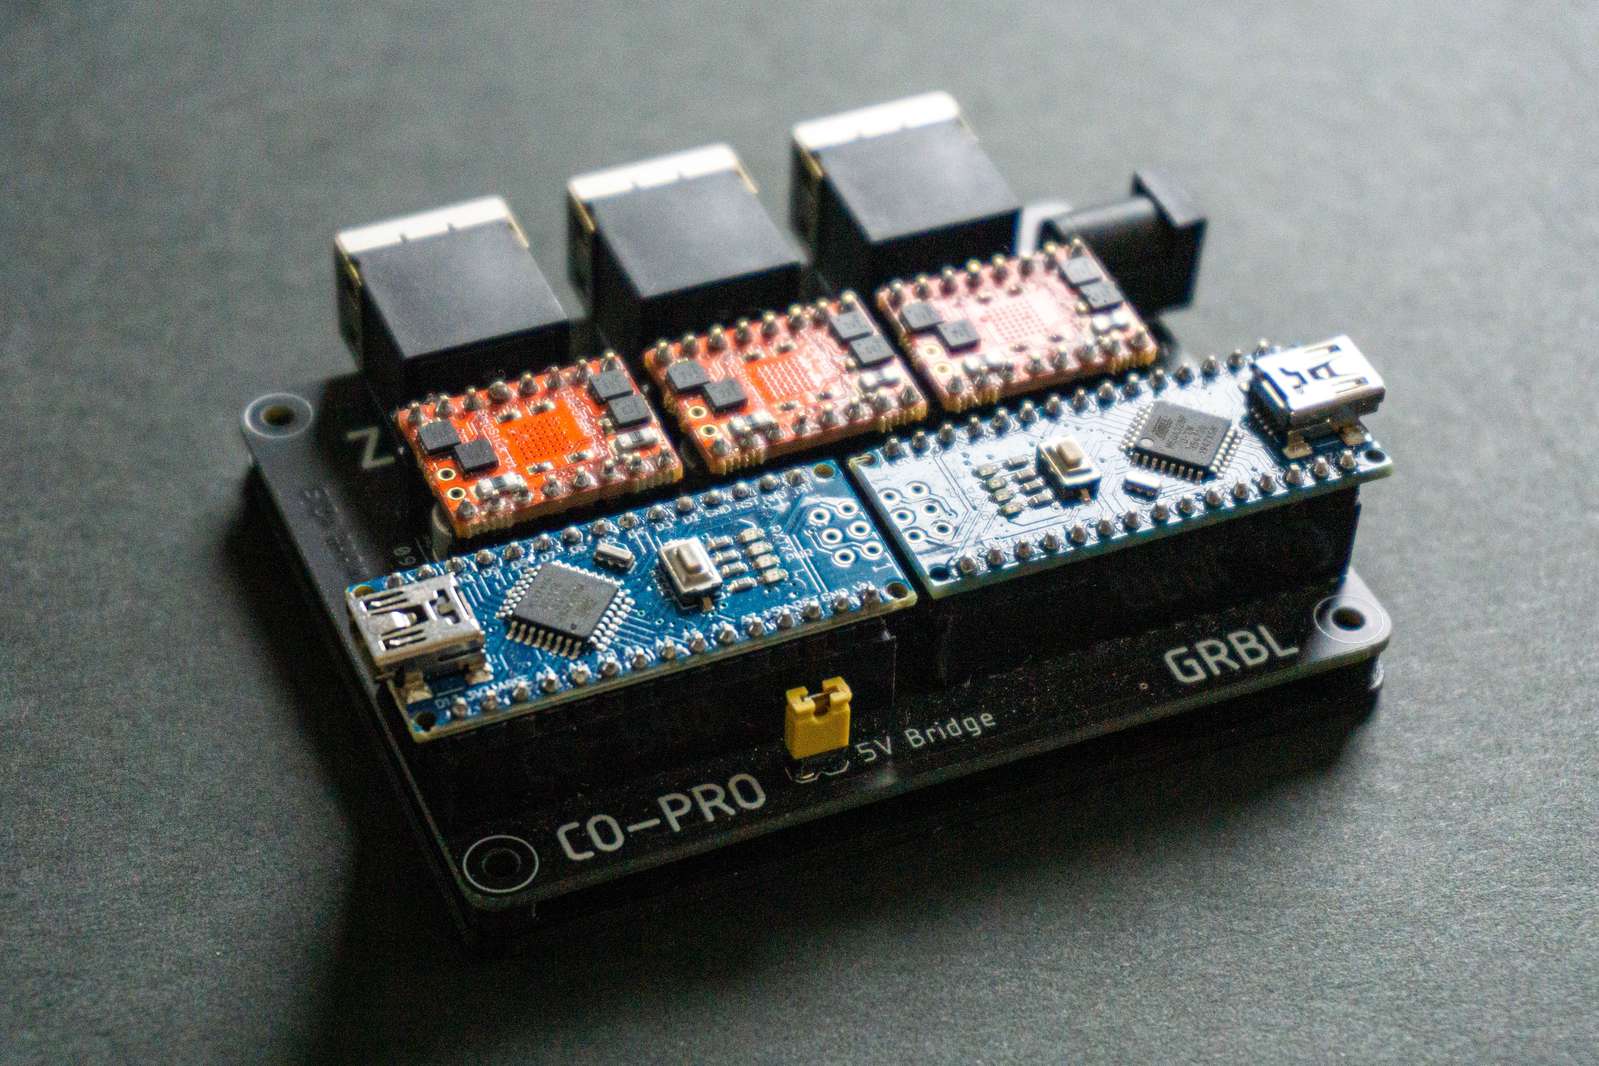
Hardware:
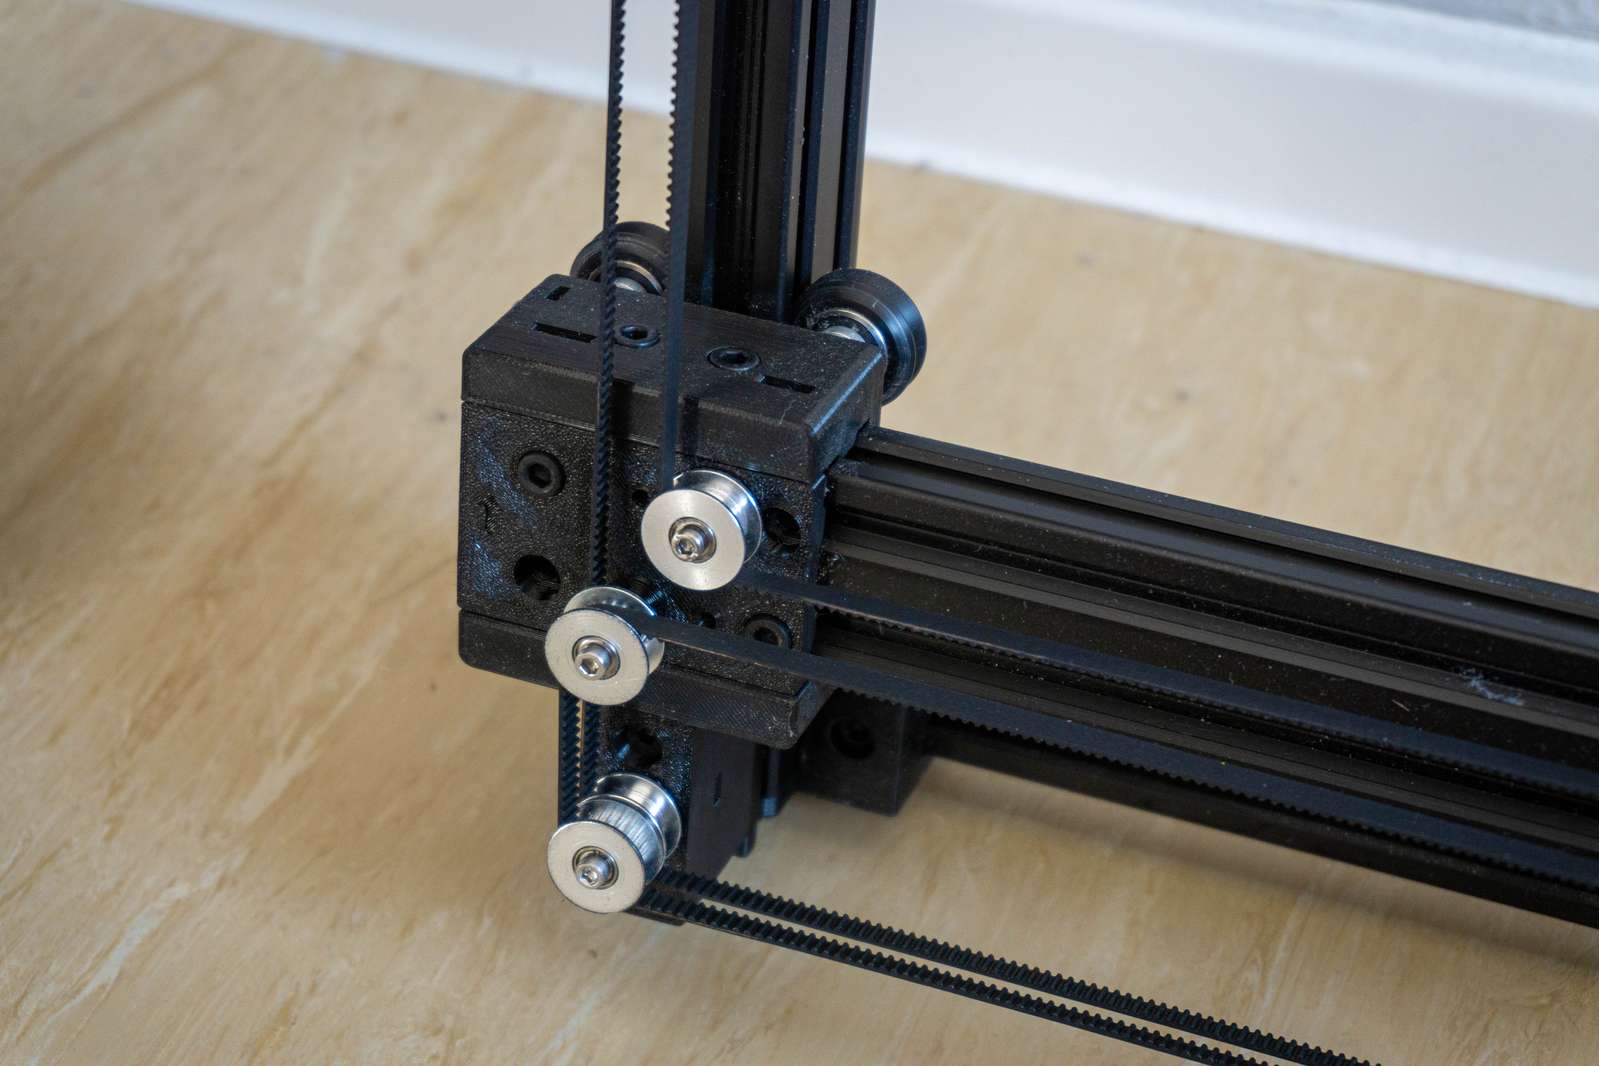
When I started building the plotter quite a while ago I was rather concerned about the size of the machine and how I could stow it efficiently. The plotter is made from Openbuilds V-Slot and 3D-printed connection elements. It’s a rectangle with belts in CoreXY-configuration and when removing the belts and undoing 2 screws per corner the plotter can be disassembled in a matter of minutes.
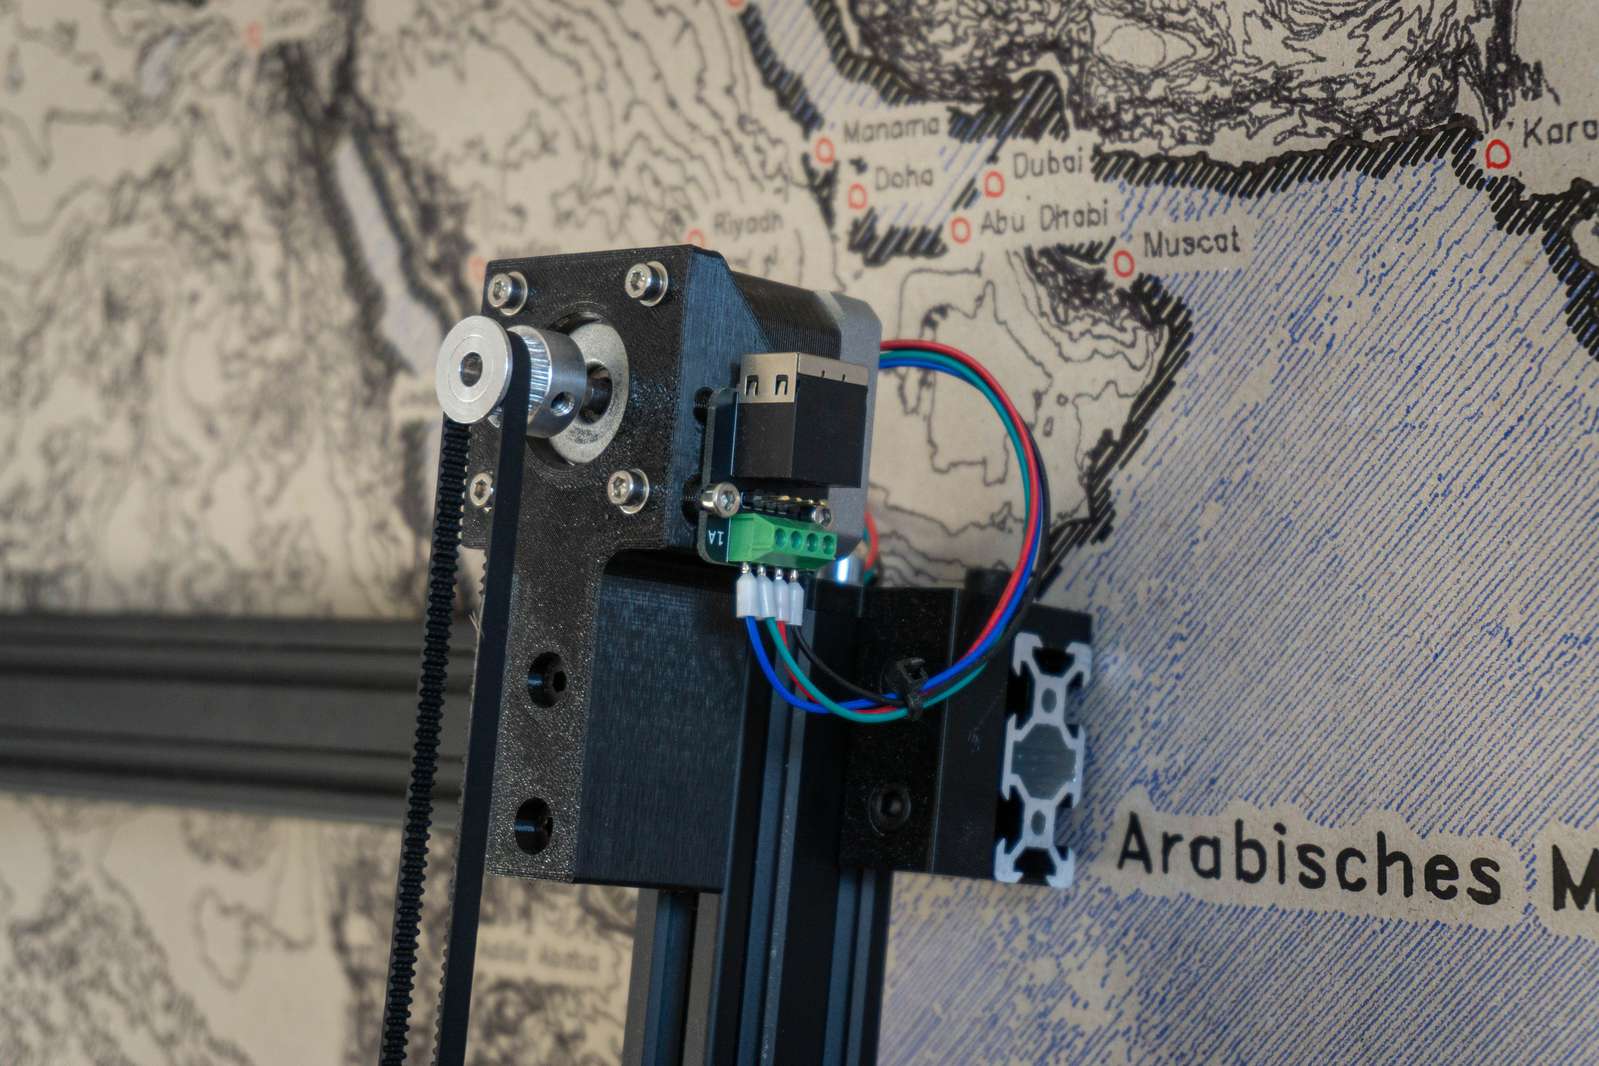
Popular plotter designs (Axidraw) commonly use small servos to move the pen up and down. That’s inexpensive and totally suitable for something like lifting a pen but the sounds the servo generates are extremly nasty. When using a pancake stepper and some decent drivers, the plotter is almost silent.
I did use the TMC5160 steppers from watterott. They are expensive as hell but extremly quiet and have a built-in stall detection that can be used for sensorless homing.
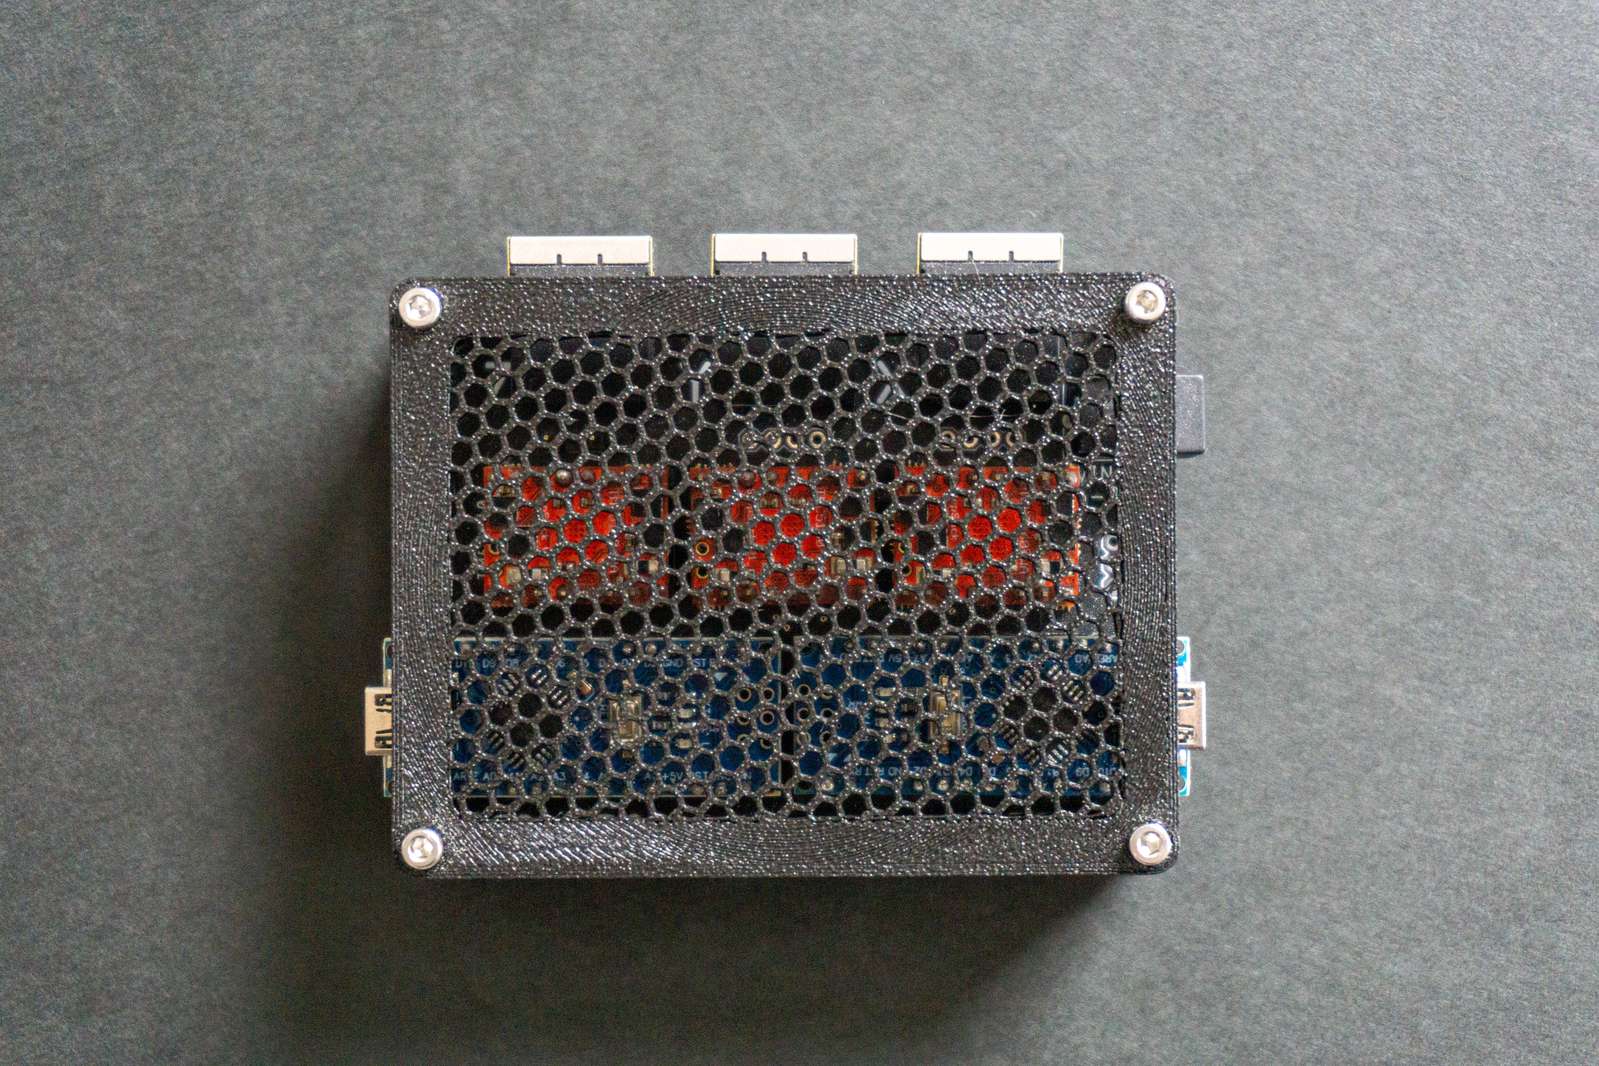
To control the motors I use GRBL, but GRBL can’t make use of any of that since you need to talk to the drivers via SPI. One can either patch GRBL (uargs…) or just use a second microcontroller. The second controller talks to the driver, checks for stall detection events and then acts like a physical endstop switch (by pulling down the first microcontrollers endstop pins). Yay, if you’re too lazy for software, just throw another bunch of hardware at the problem…
The plotter requires only a minimal amount of torque, so running the motors on CAT5 cables works well and is extremly convenient. Each wire-pair drives one motor phase. Several meter of cable length are not an issue and no stepper motor looses steps.
Plotting:
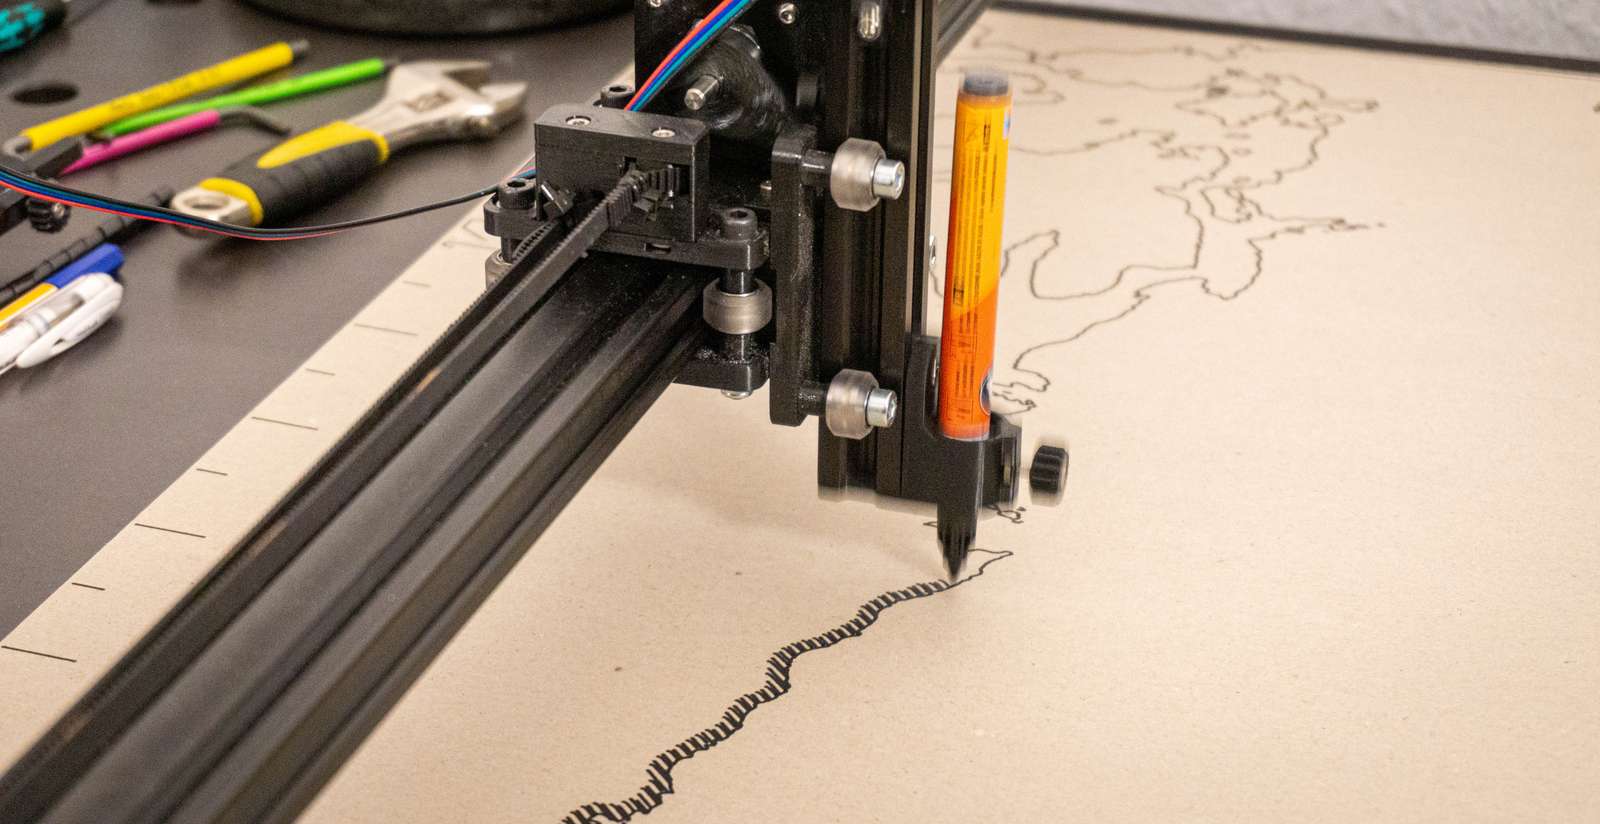
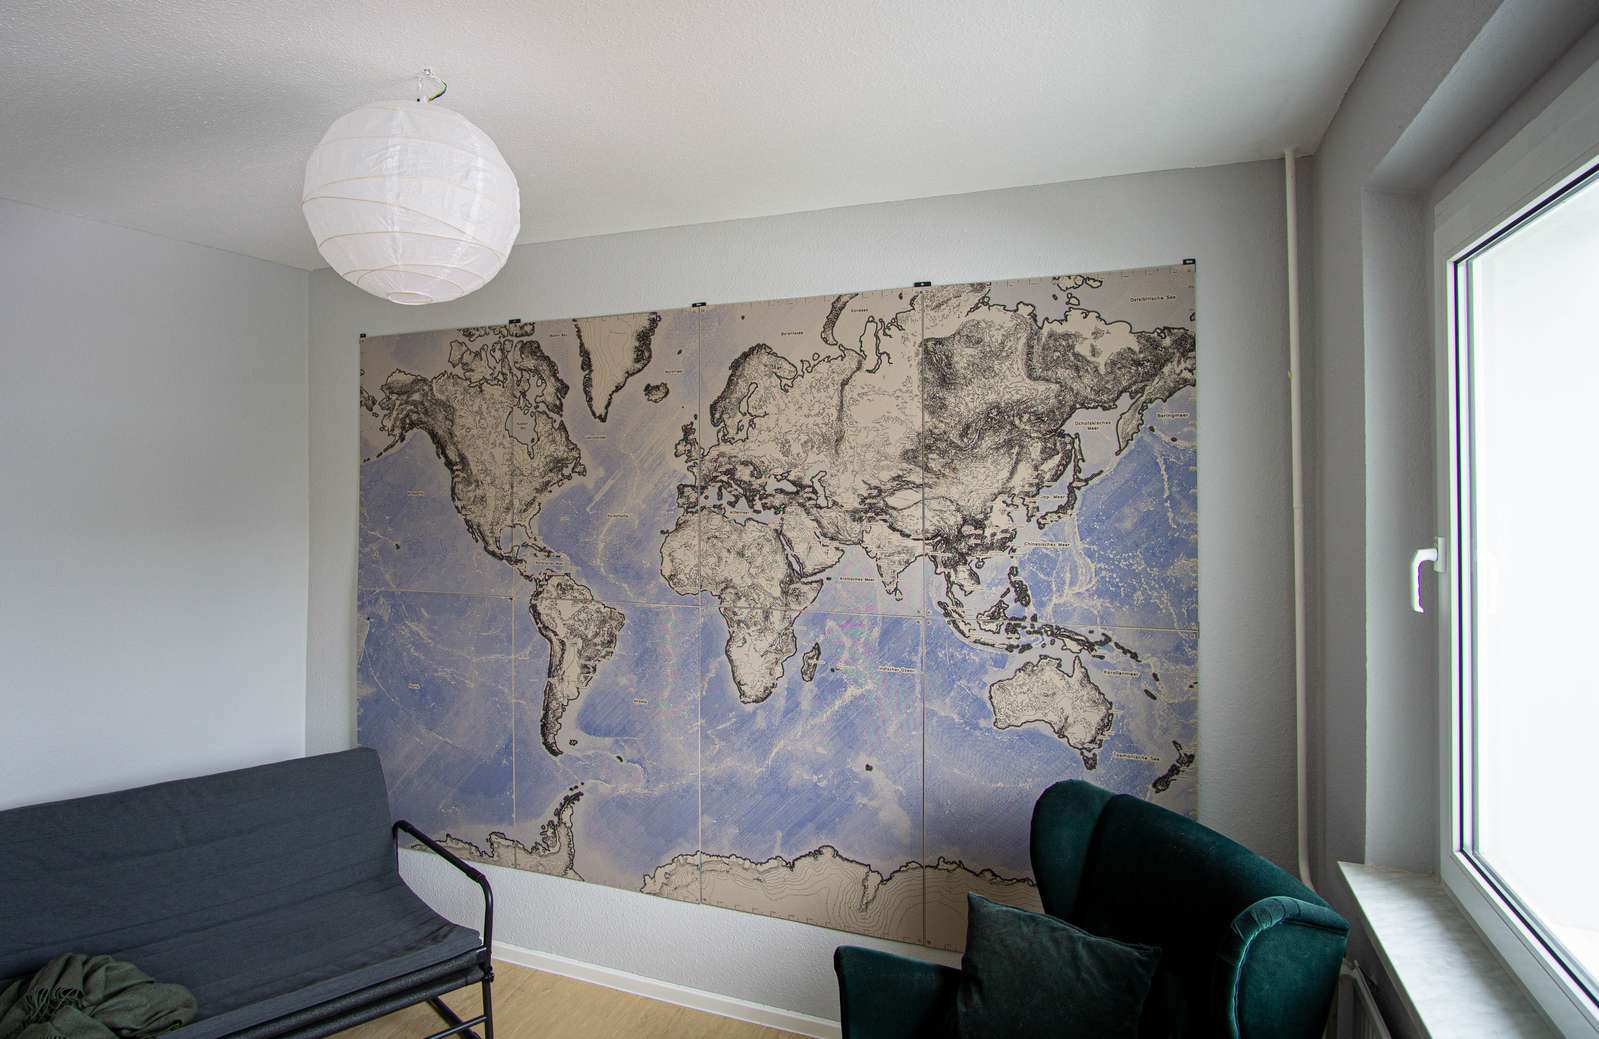
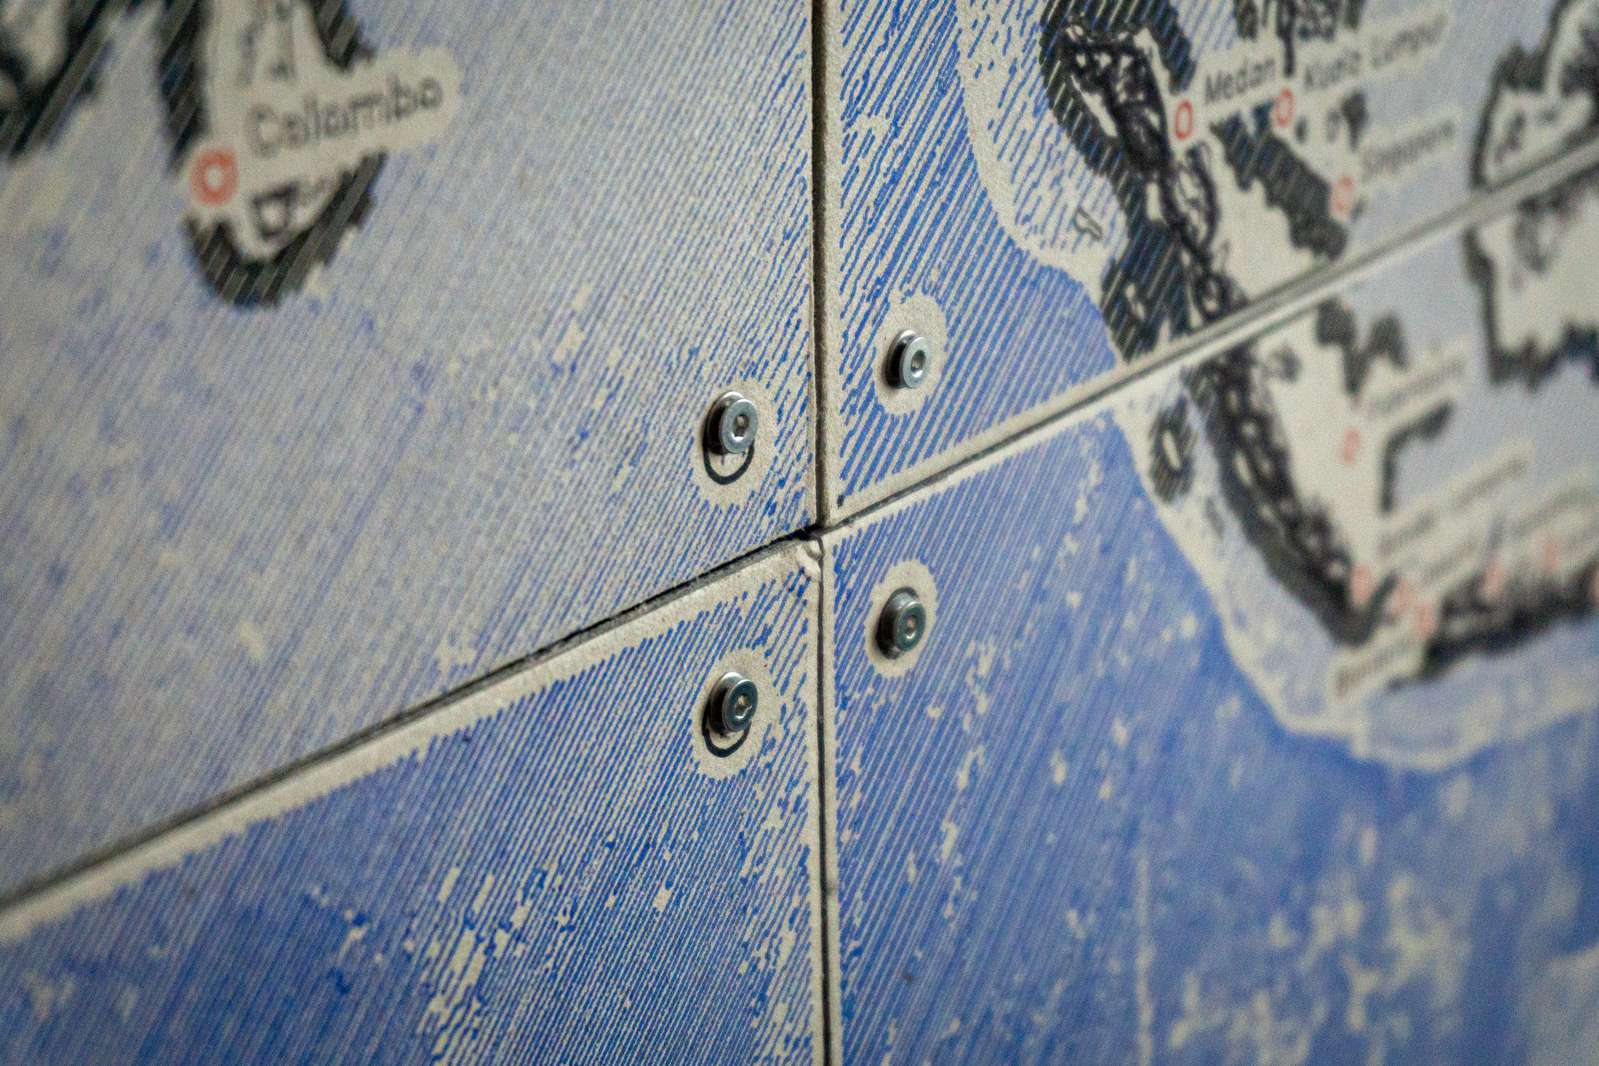
To actually get the lines on the wall I initially planned to draw directly on the wall with a slightly different pen-plotter build. However, in the end I spared my neighbours weird moments hearing the mysterious sounds of scratchy pens on the other side of the wall. I settled on plotting on cardboard sheets as tiles and used 2x4 (2 by 3 meters in total) to fit the map to the wall.
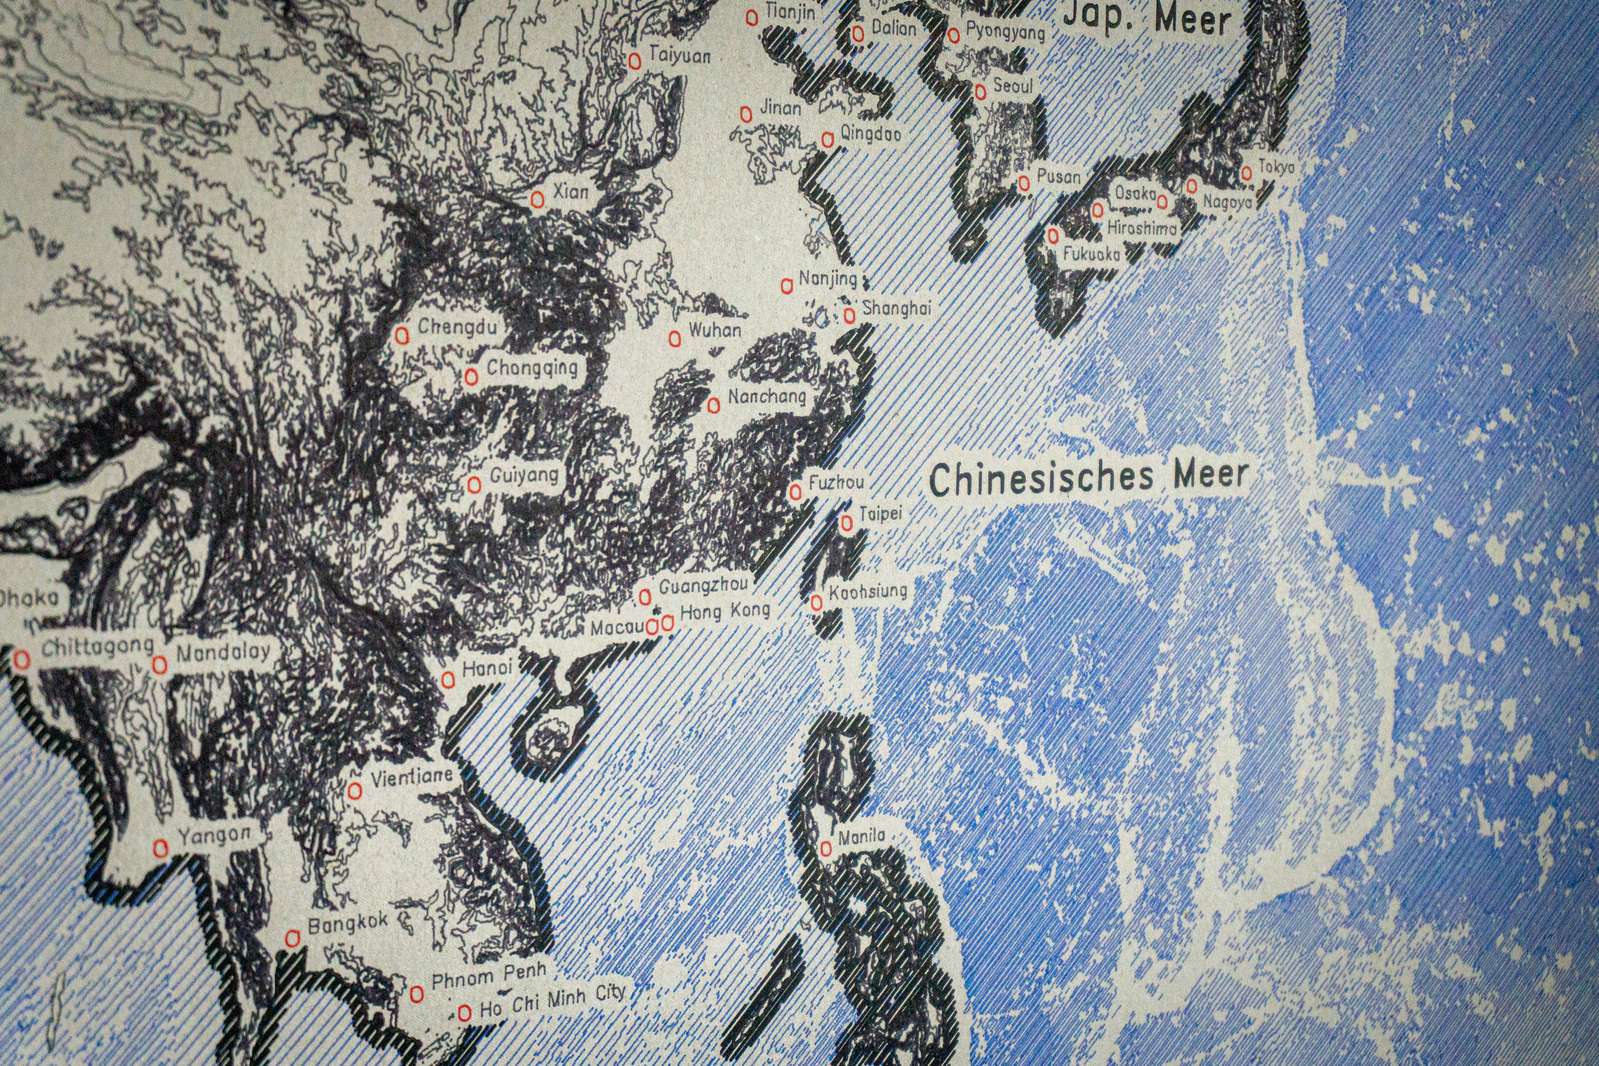
To draw text I made use of Hershey fonts, stroke-based fonts originally developed for vector displays back in the ol’ days.
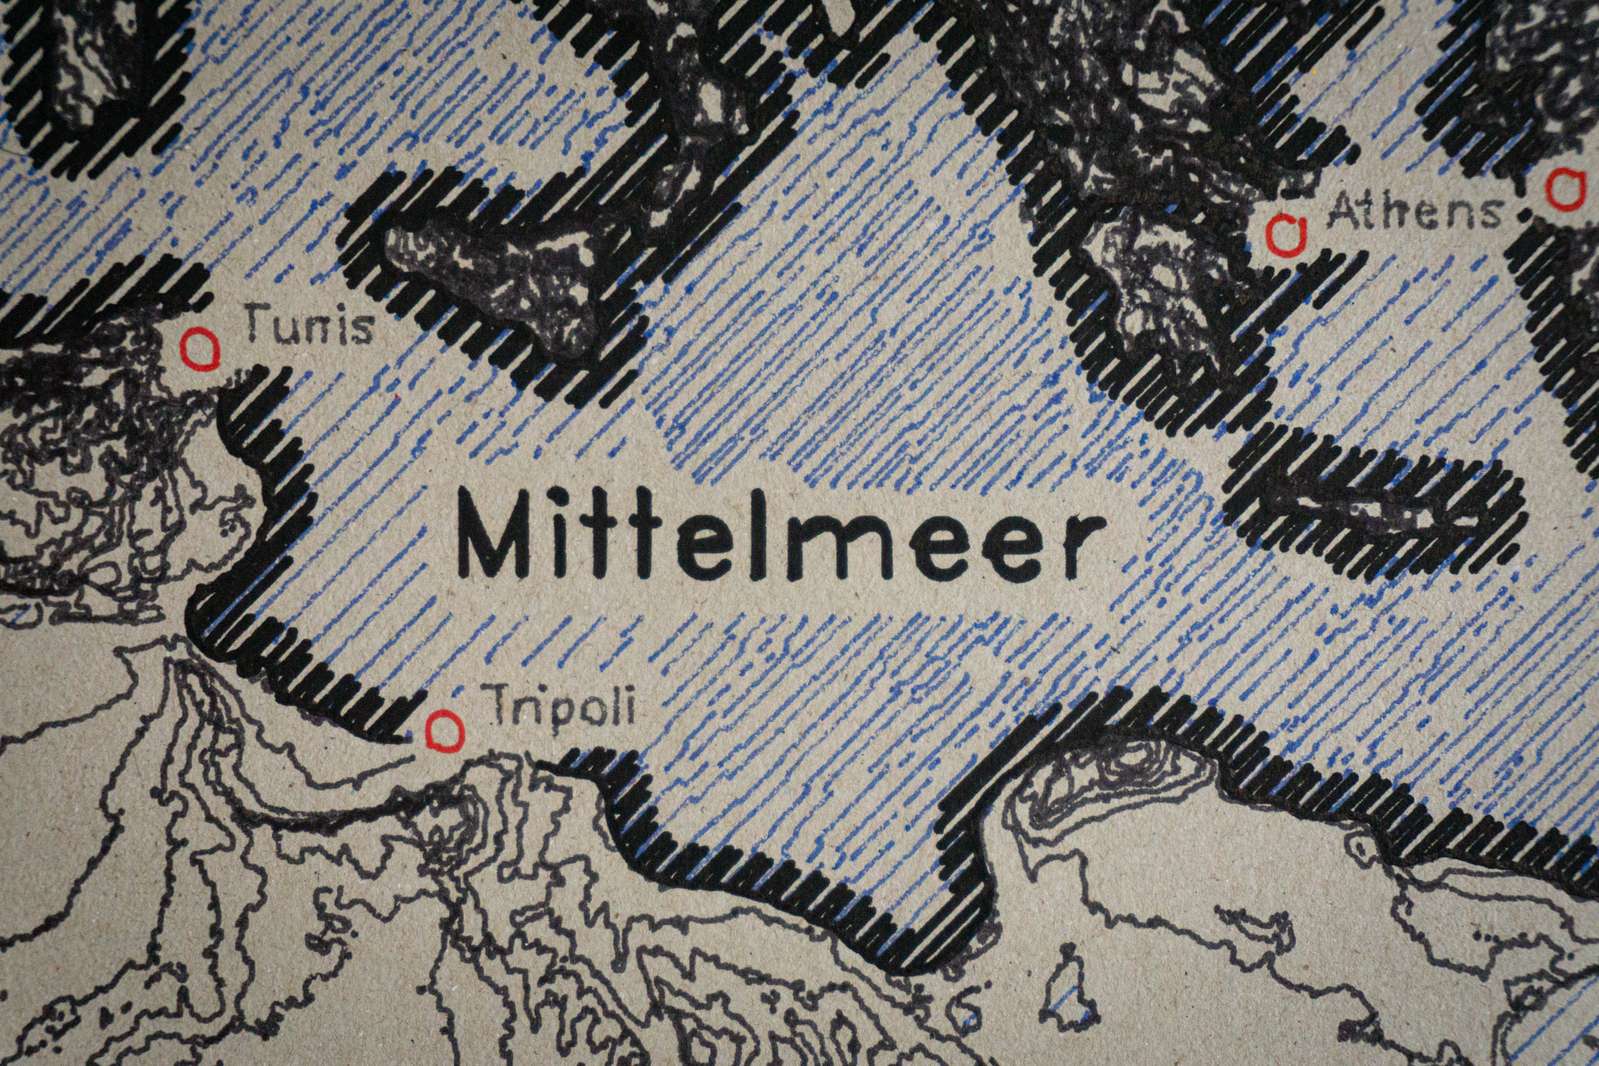
While elevation data for land is drawn as countour lines, I did not want to do the same for bathymetry (ocean depth) data. Here I used hatchings of increasing density to display deeper regions as more blue-ish in color.
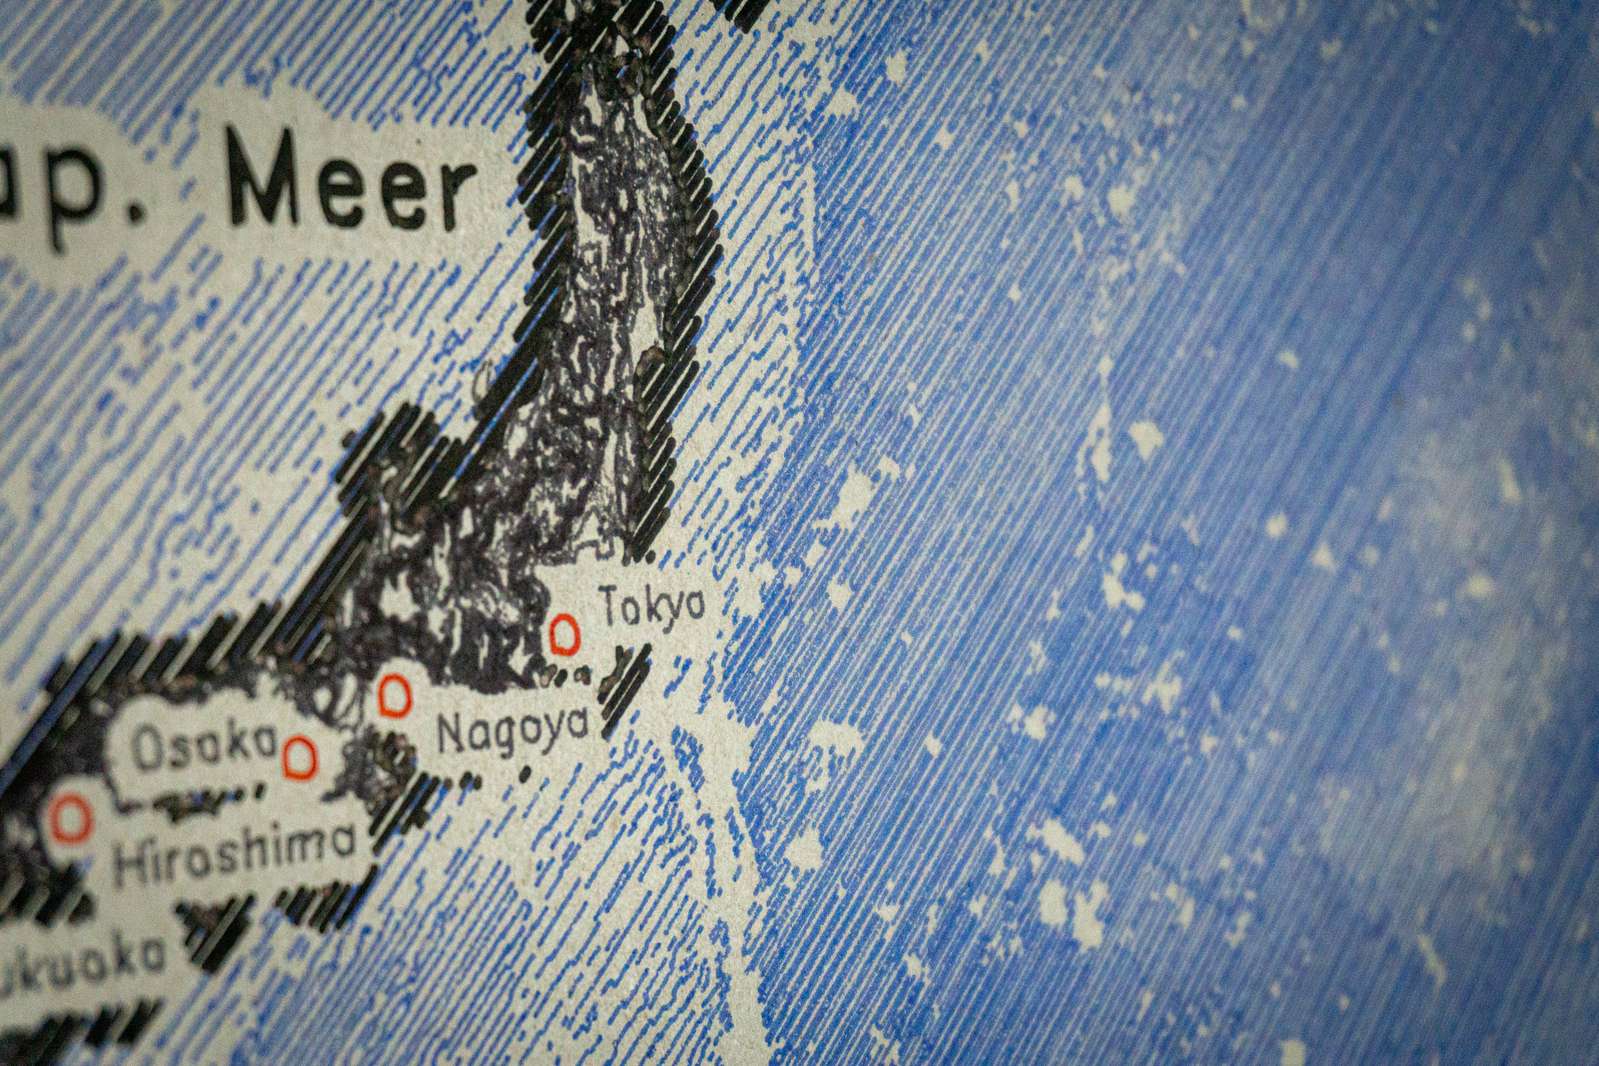
That resulted in a few issues since the 45 degree hatching lines are really sensitive to placement. Every mechanical system only runs up to certain level of precision and blacklash in the drive system is one of main reasons for this. Since I am using almost 5m long belts to control the movement of the pen in the pen-plotter, there is a quite an amount of slack. Every other line is slightly too close to it’s neighbouring line. That results in a kind of banding effect for large monotonous hatching-regions.
Plotting took about a day per tile and all in all I used up quite an amount of pens:
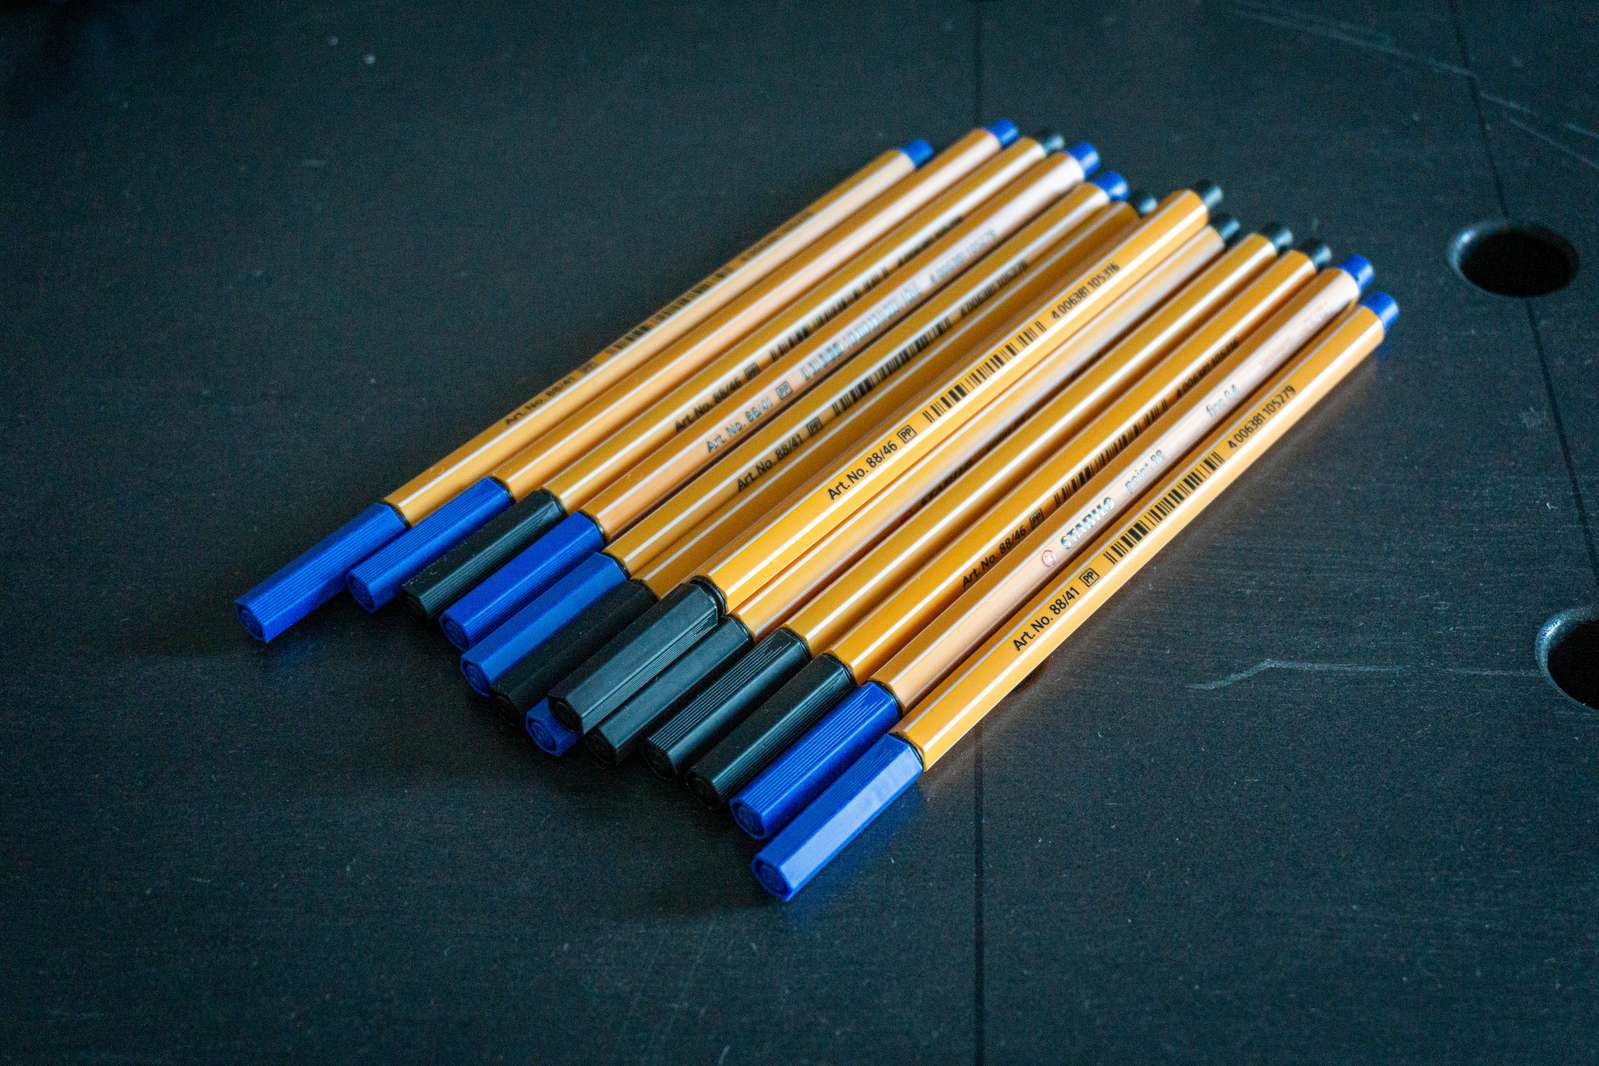
A Stabilo ballpoint pen is good for about 250m of lines (quite impressive). The lines are split into files to automatically pause after a certain number of meters for pen replacement.
Afterwards the cardboard tiles are screwed to 3d-printed connectors which are sitting on the wall and allow for a bit of alignment (in hindsight this was a very good idea).
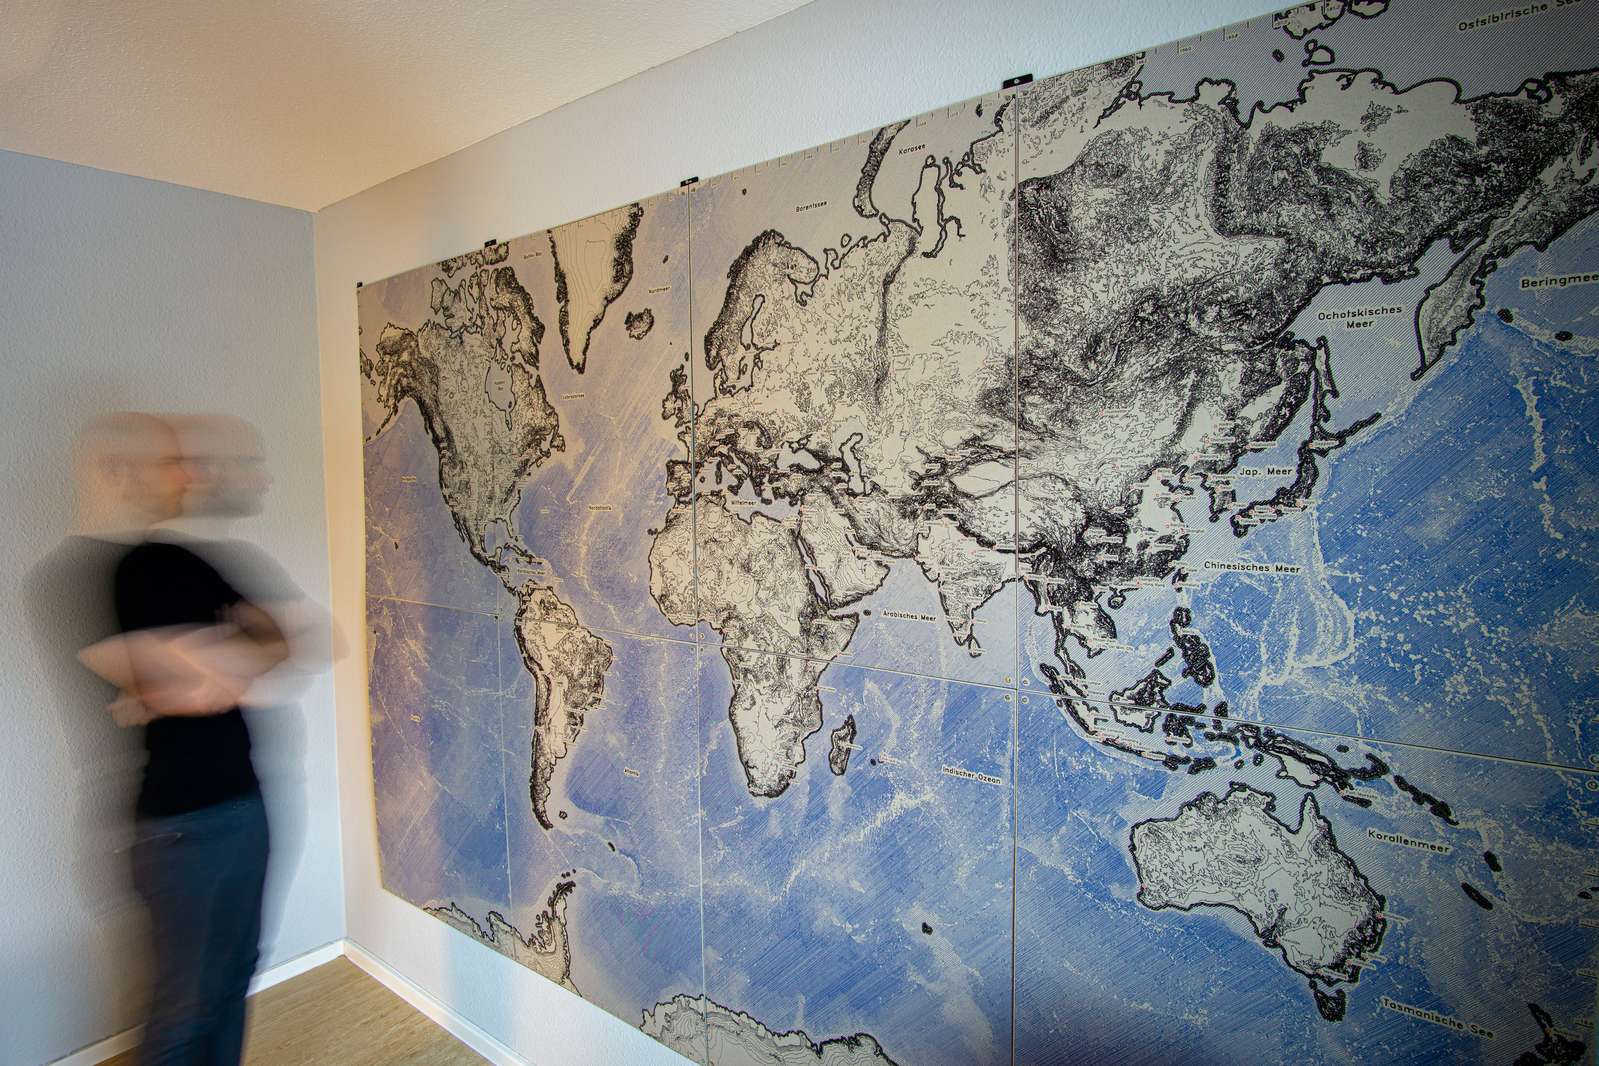
All in all I would say I am quite happy with the results:
Hardware and software can be found on github:
- plotmap repository: Python code to generate SVG maps and scripts to convert SVG paths to GCODE instructions
- drawbot repository: drawbot board and firmware
Further reading:
- There are wonderful pen-drawn terrain maps by Michael Fogleman (see here). Highly recommended if you appreciate the visual style of these kind of maps.
- For large-scale plotting people often refer to the Polargraph. If you are new to pen plotting, you can find a lot of inspiration there.
- When just wanting to have a stab at pen plotting without worrying too much about hardware, the Axidraw is an excellent choice. An inkscape extension allows for easy drawing and sketching. EvilMadScientist is now even selling a nice litte DIY kit.
- The twitter hashtag plottertwitter is highly recommended.
I am always happy to recommend the Axidraw A3 plotter which is the largest modern pen plotter you can buy right now and it has excellent software support via Inkscape.