Littleplanets
22 Apr 2026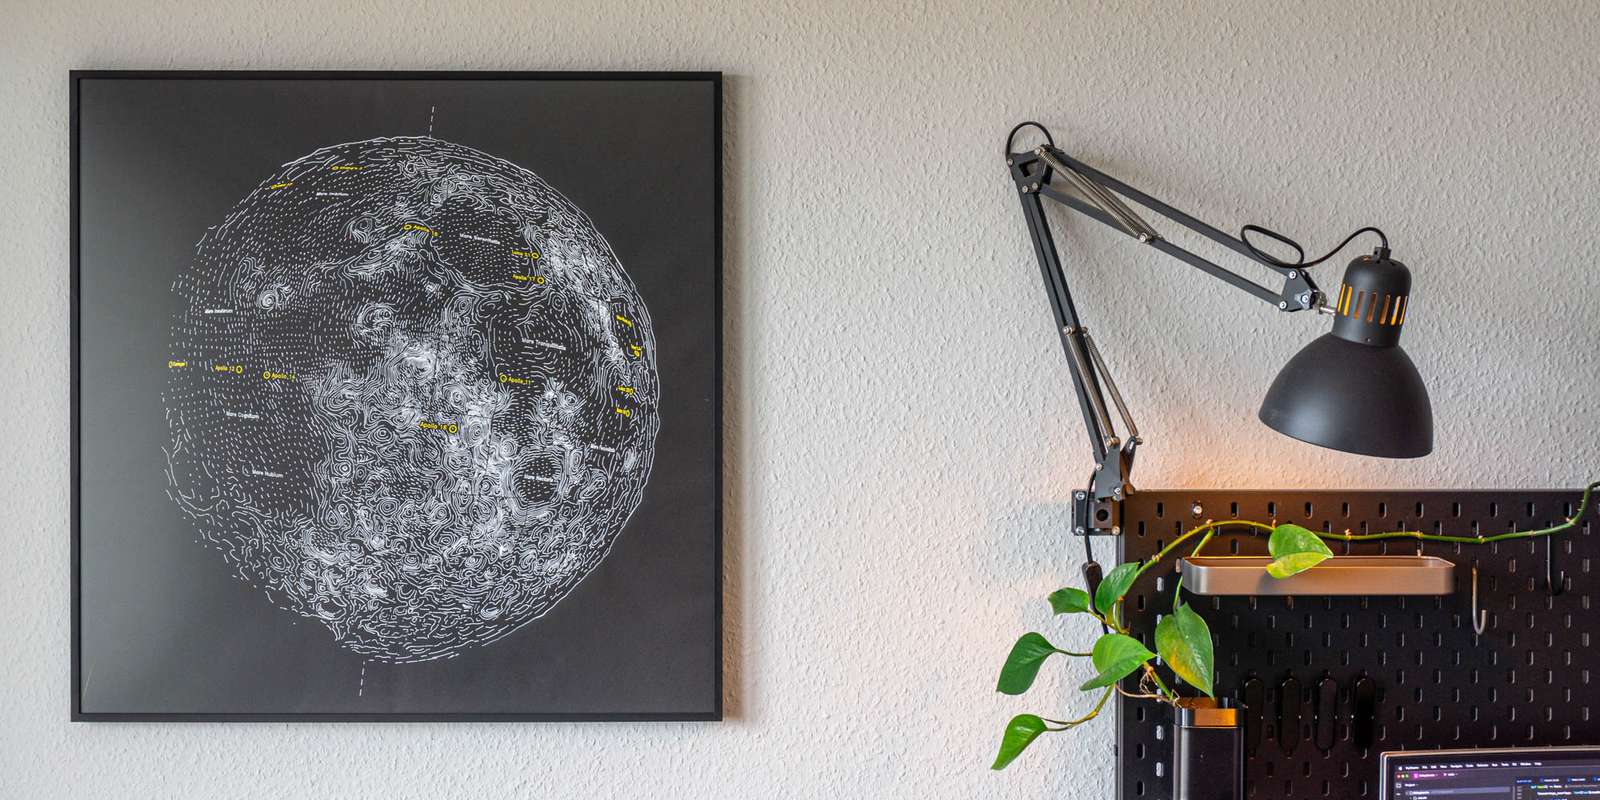
Recently, I felt the urge to see if I can make drawings of planets (and the Moon) from NASA data with a simple pen plotter.
In the past I’ve made a very large world map with a machine that moves a pen with belts and motors (commonly called a pen plotter). Writing code to generate lines that should give an impression of lights and shadows, follow a relief, and resemble seas and mountains in the end, is a lot of fun. Not so much once you end up thinking about mapping projections, but everything else.
Born from this was the idea to circumvent mapping projections altogether, not bending locations on a sphere to cartesian coordinates on a 2D surface, but directly drawing the landscape on the sphere, or in this case, chubby little planets. Since space is black, as it is known, it only makes sense to draw with colored light (or ink) directly on black paper. Finding ink that could produce a vivid line on a black background and a way of applying it reliably was considerably more of a pain than anticipated.
In the end, everything was way more complicated than anticipated, but as always: “We choose to do things not because they are easy, but because we thought they are.”1
Drawing Theory
To write some code that does generates lines for me, I had to understand a bit about drawing beforehand and drawing three dimensional shapes on two-dimensional paper involves a bit of theory about light and shadows and how the human mind perceives lines.
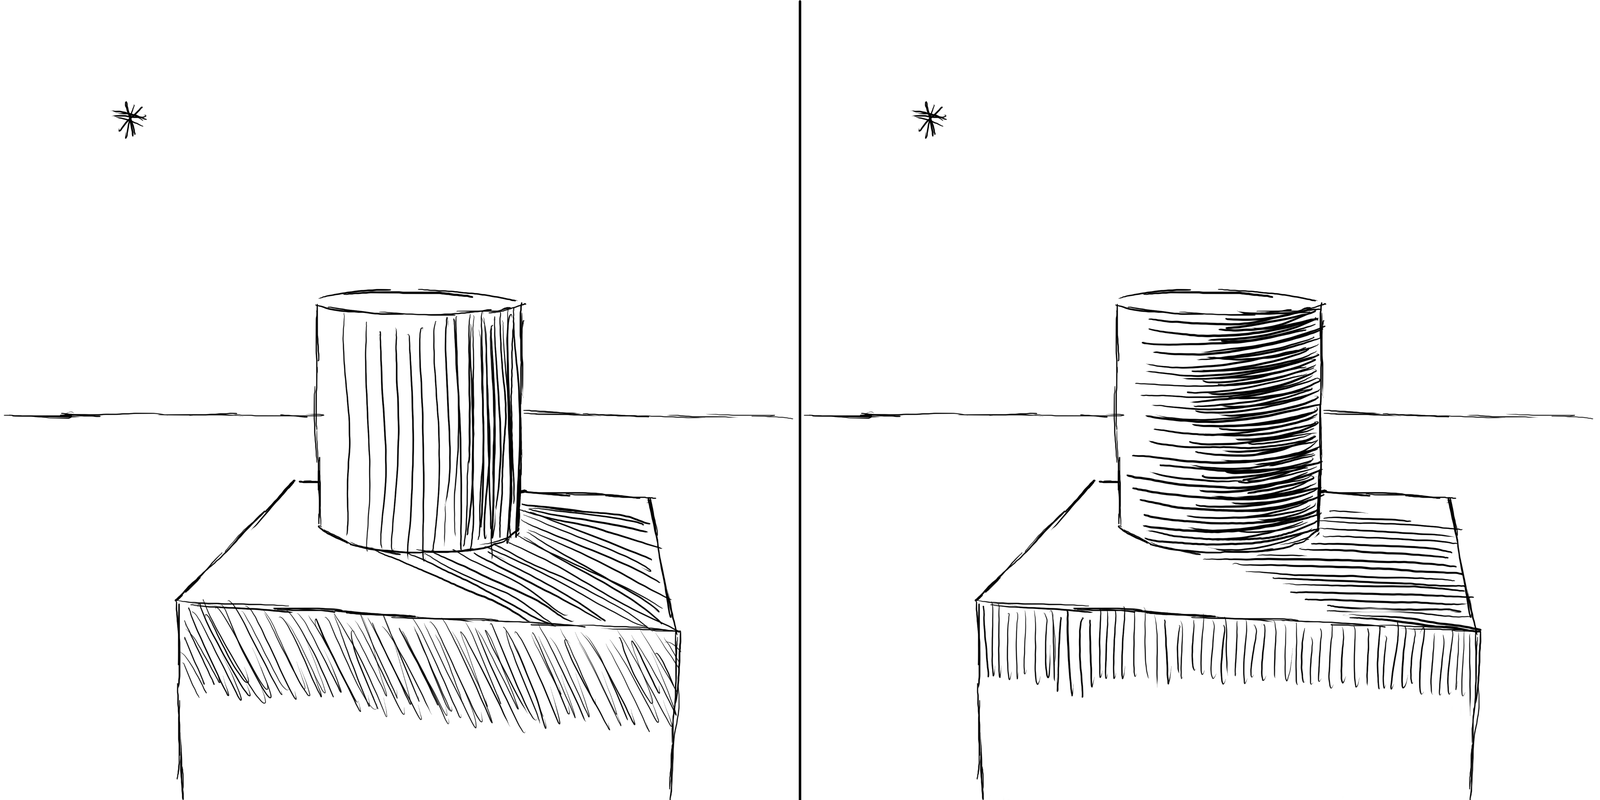
A very quick summary: a contour line captures the silhouette of an object while hatching lines create the illusion of light and shadow to describe the shape. This illusion can be amplified if the hatch lines either follow an axis along the surface of the object, or run perpendicular to it.
To illustrate this, people often refer to Albrecht Dürer or other artists that created copper plate carvings:
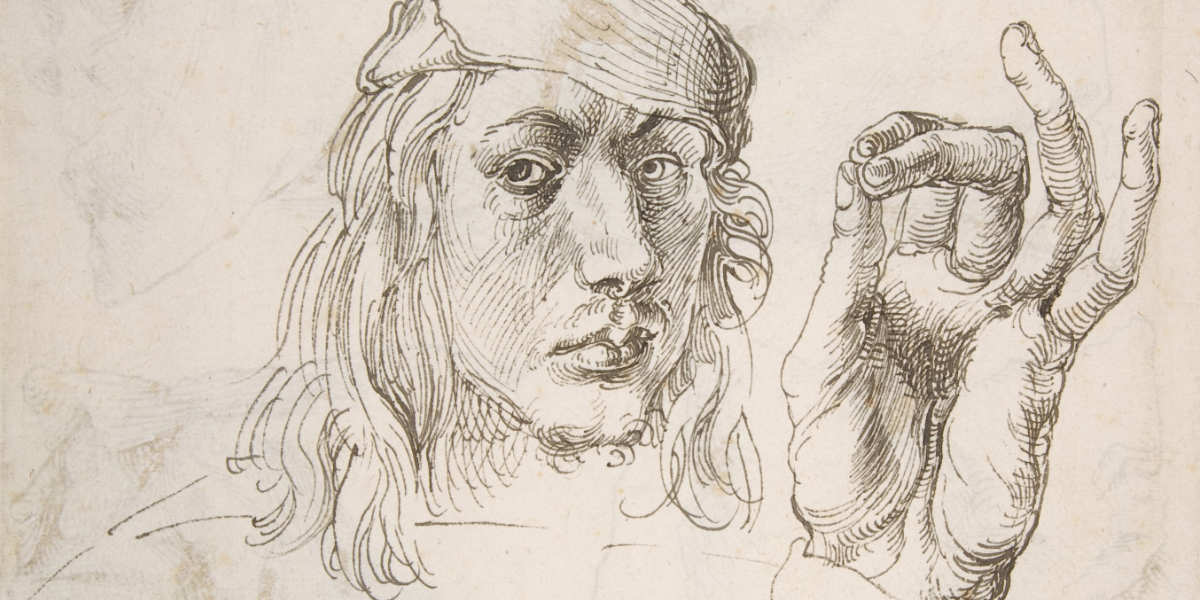
Study of a Hand and a Pillow - Albrecht Dürer, 1493, Public Domain
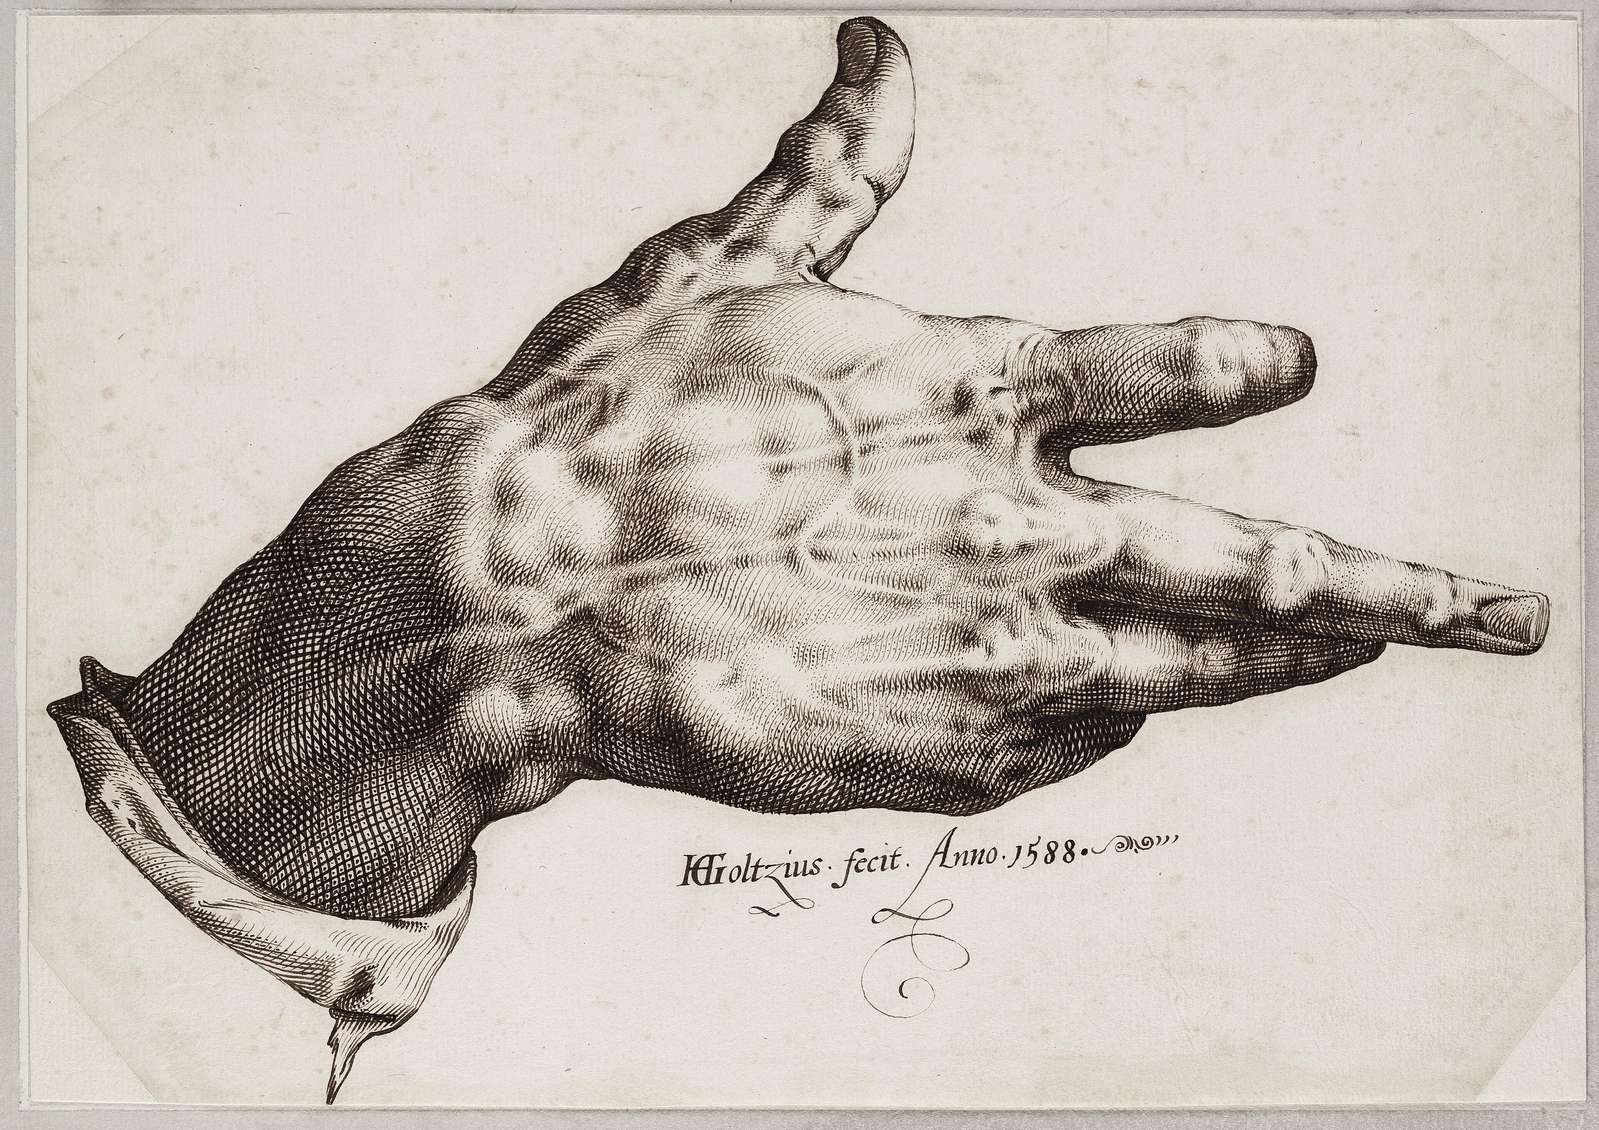
Goltzius’s right hand - Hendrick Goltzius, 1588, Public Domain
Transferring this into the domain of machines and generating “drawing-like” output from 3D data was a hot topic in some computer graphics research departments sometime in the early 2000s, called non-photorealistic rendering.
A collection of academic papers I found useful:
| Paper | Authors | Year |
|---|---|---|
| Comprehensible Rendering of 3-D Shapes | Saito, Takahashi | 1990 |
| Illustrating Smooth Surfaces | Hertzmann, Zorin | 2000 |
| Contesse: Accurate Occluding Contours for Subdivision Surfaces | Liu et al. | 2003 |
| Ridges and Valleys | Ohtake et al. | 2004 |
| Apparent Ridges | Judd et al. | 2007 |
| Highlight Lines for Conveying Shape | DeCarlo, Rusinkiewicz | 2007 |
| Where do people draw lines? | Cole et al. | 2008 |
| How Well Do Line Drawings Represent Shape? | Cole et al. | 2009 |
| Suggestive Hatching | Singh, Schaefer | 2010 |
| Stylized Line Drawings for Shape Depiction (meta review) | Al-Rousan et al. | 2015 |
| Feature Lines for Illustrating Medical Surface Models: Mathematical Background and Survey (meta review & comparison) | Lawoon, Preim | 2015 |
| Line Drawings from 3D Models: a Tutorial | Bénard, Hertzmann | 2019 |
Some publications discuss how artist build an intuition about where lines should be placed to convey the impression of a certain three-dimensional shape (i.e. on contours of objects, on ridges, on valleys, etc.), others propose algorithms to derive the exact location of these features on the surface of an object in relation to the camera.
I experimented with some of the concepts, (Ridges and Valleys, Apparent Ridges), but settled on a rather simple approach similar to map contours lines, more about this later.
Processing Pipeline
The first step in generating a drawing is find the shape you want to draw:
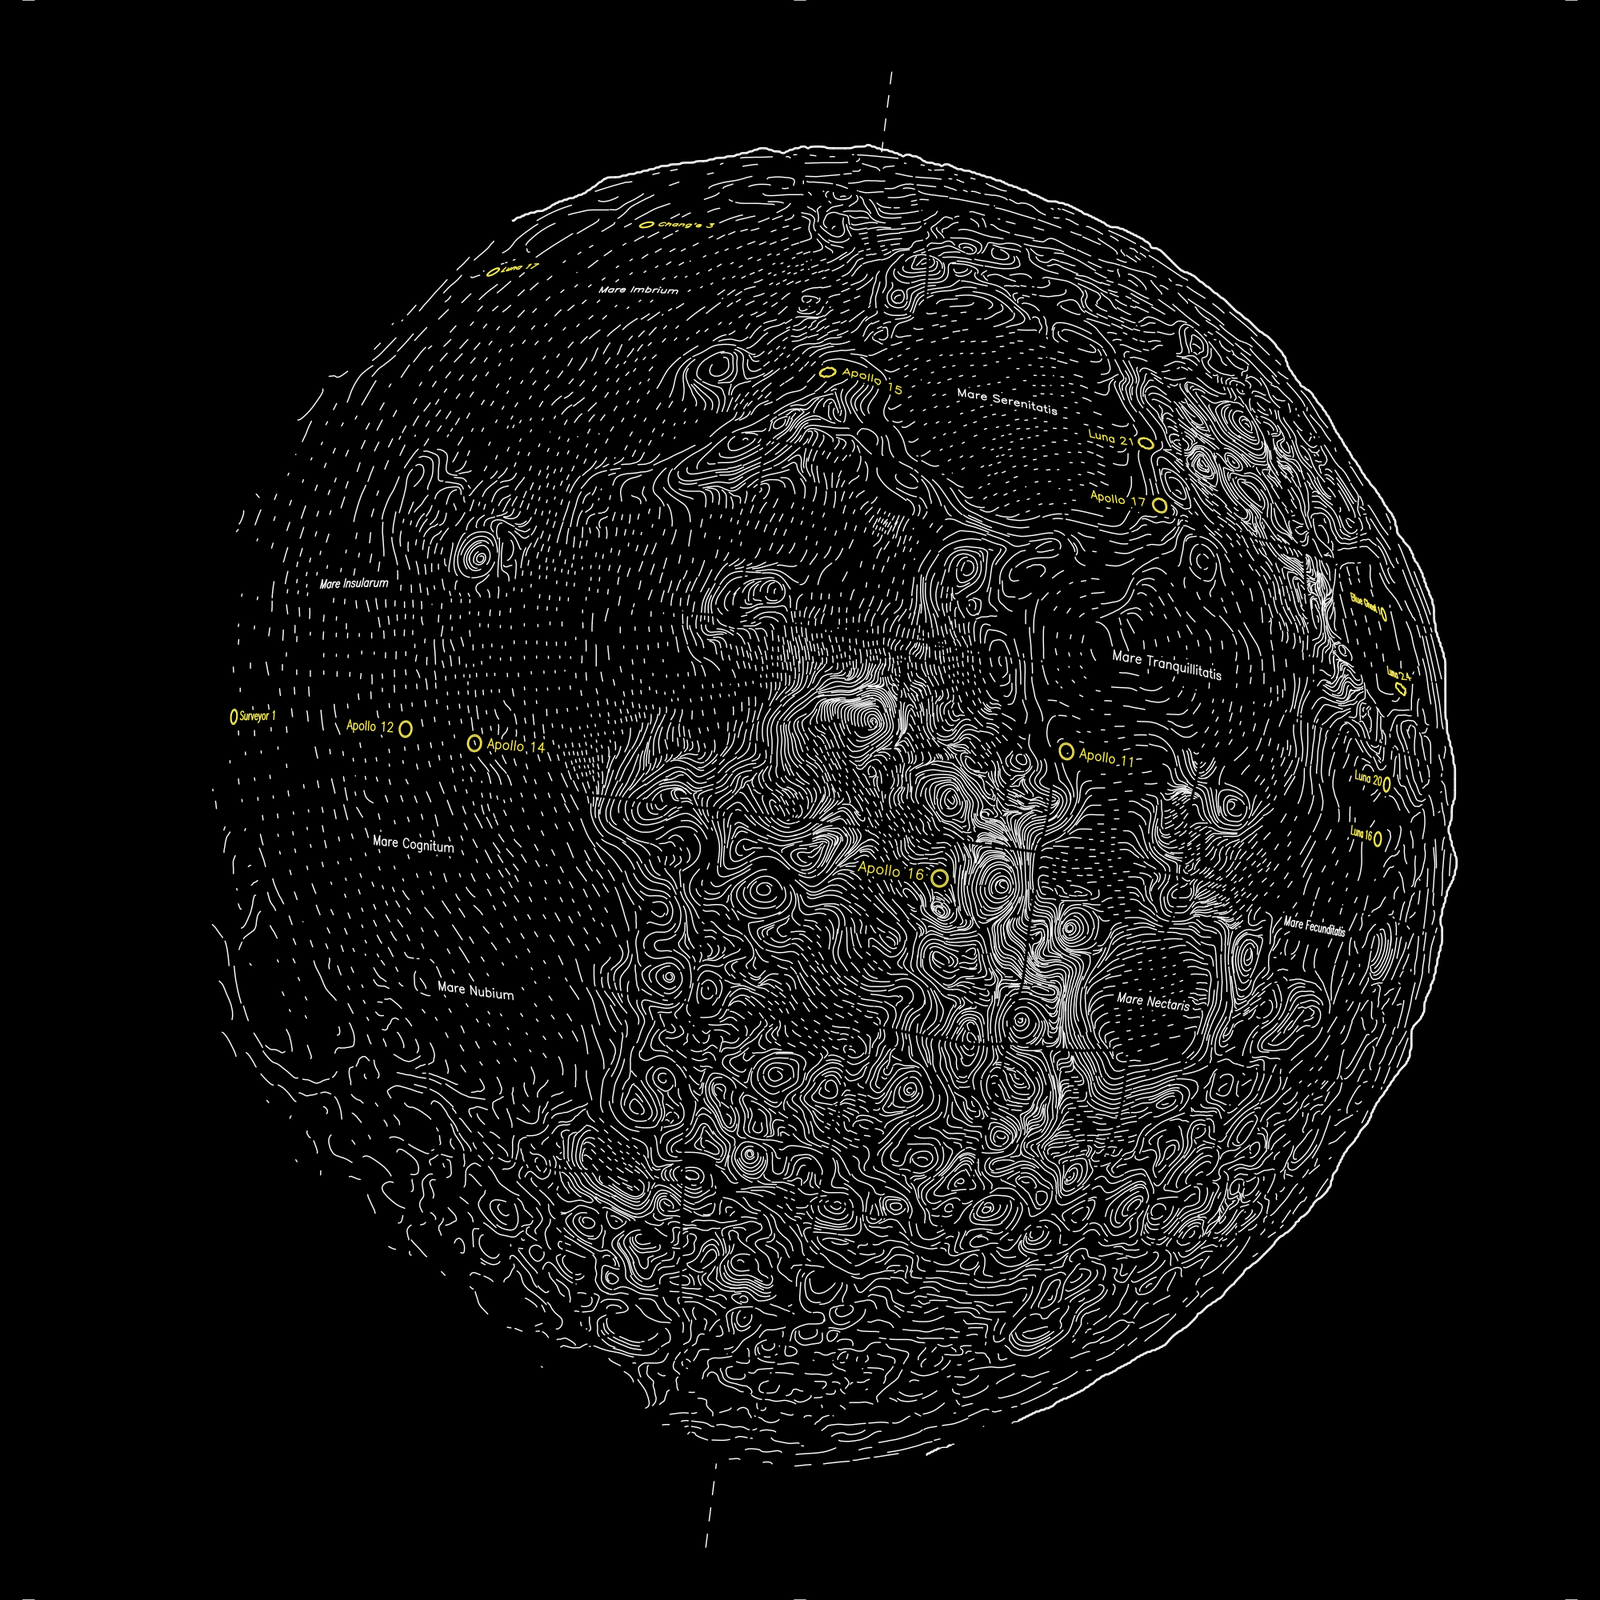
Digital elevation models (DEM) and surface color datasets are published by the NASA and sibling agencies. For the moon I am using the DEM data provided by the Lunar Orbiter Laser Altimeter (LOLA) instrument on the Lunar Reconnaissance Orbiter (LRO) spacecraft, thus the dataset is available under the name Moon LRO LOLA DEM 118m.
Some areas of the model will have a lower resolution or might be missing altogether (around the poles) due to the orbit of the spacecraft. Some datasets try to correct for this, some just leave out the poles altogether.
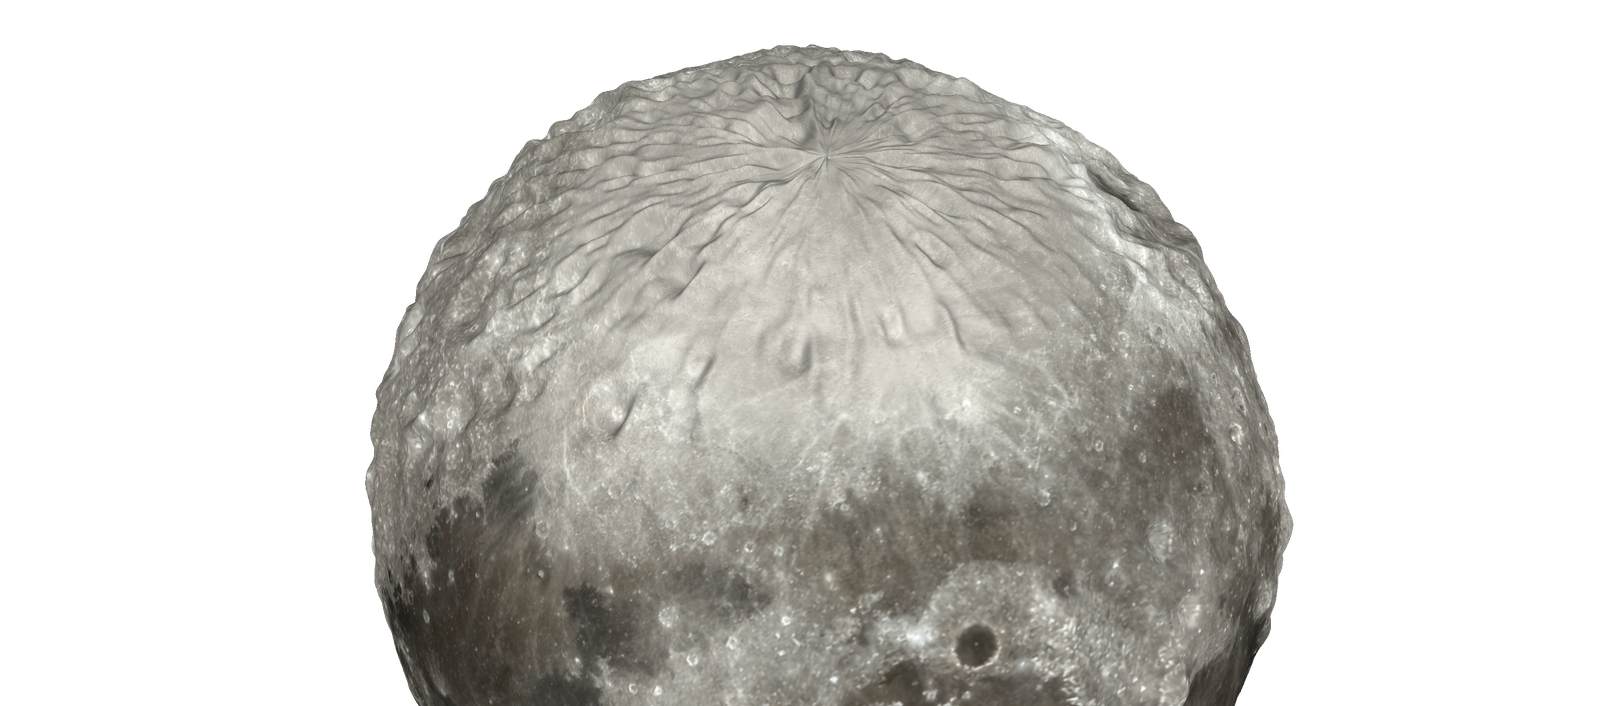
Surface color data is harder to interpret than elevation data, the scientific cameras capture a broad part of the spectrum and need extensive post processing until you get an image with colors that look similar to what you would expect looking through a telescope. For the moon the best source I could find is the camera output of the Lunar Reconnaissance Orbiter, however, some contrast adjustments are still necessary in the image processing pipeline.
With elevation data and surface color info it’s straightforward to generate a triangle mesh of the celestial body, which is the reference object for all further processing. Meshes are saved in the Polygon File Format (.PLY), that’s just an ASCII file and can be written without a complex library.
The mesh is then imported and rendered in Blender:
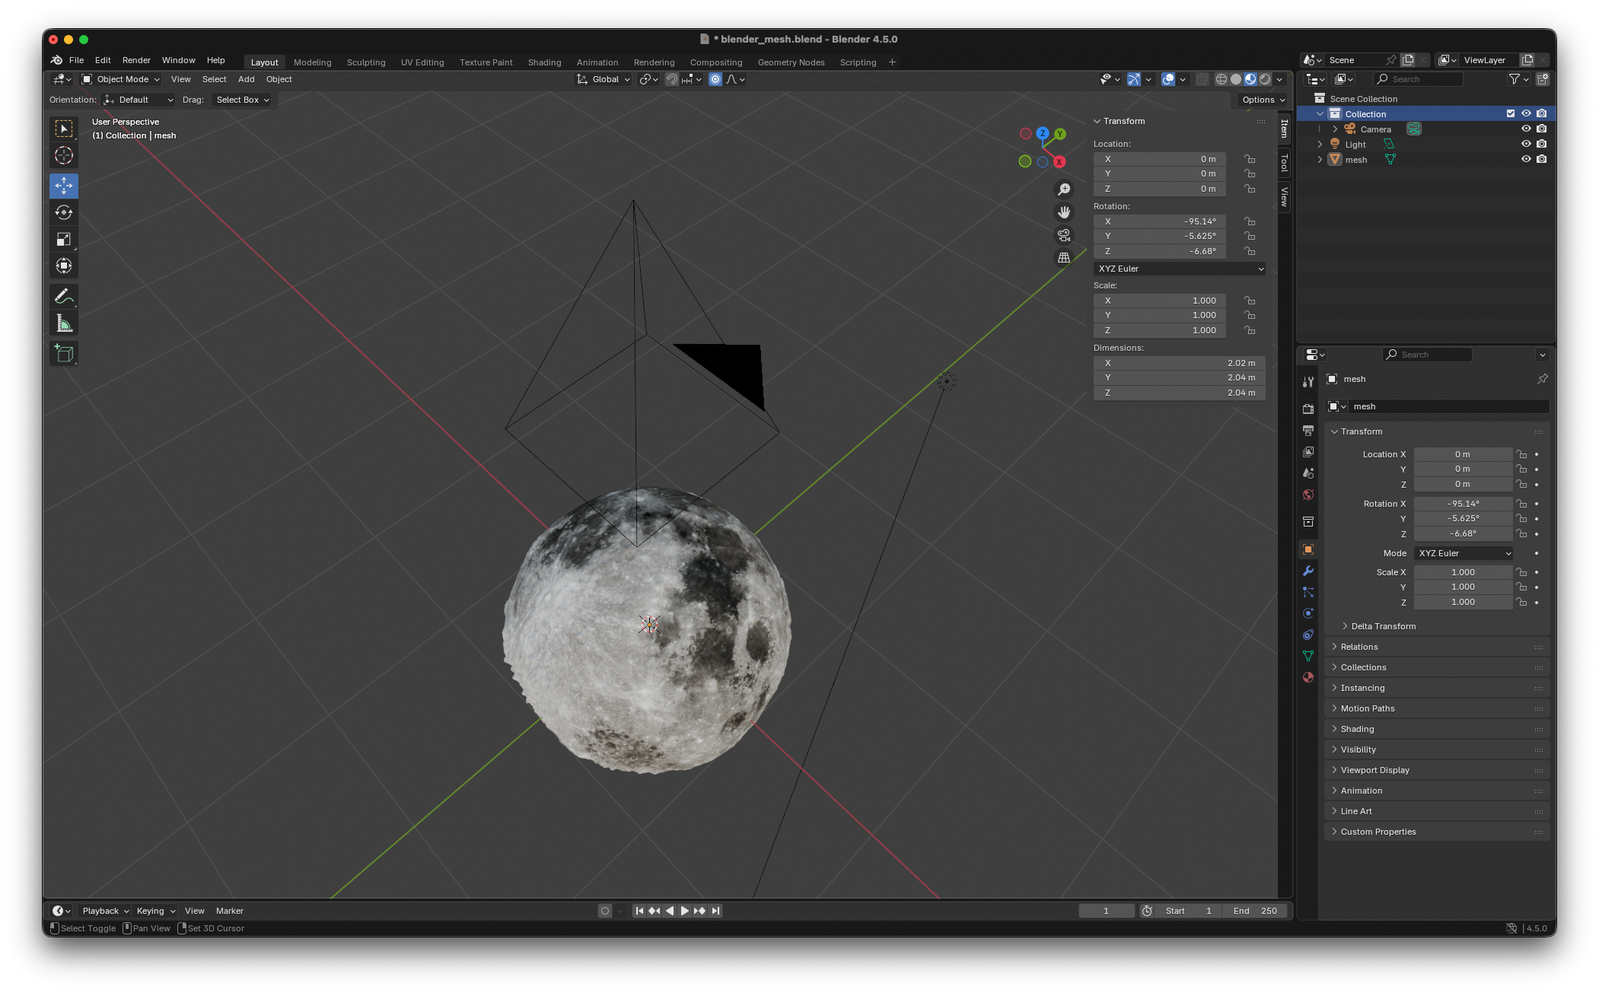
And Blender does the heavy lifting for a lot of computations:
- Camera placement, focal length computations, projection matrix, etc
- The raytracing and rendering of an RGB image (color, light and shadows) from the point-of-view of the camera
- Normals for each pixel (how is each surface oriented?)
- World coordinates for each pixel (where is each surface located?)
- Occlusion checking for overlays (is an overlay line visible from the camera?)
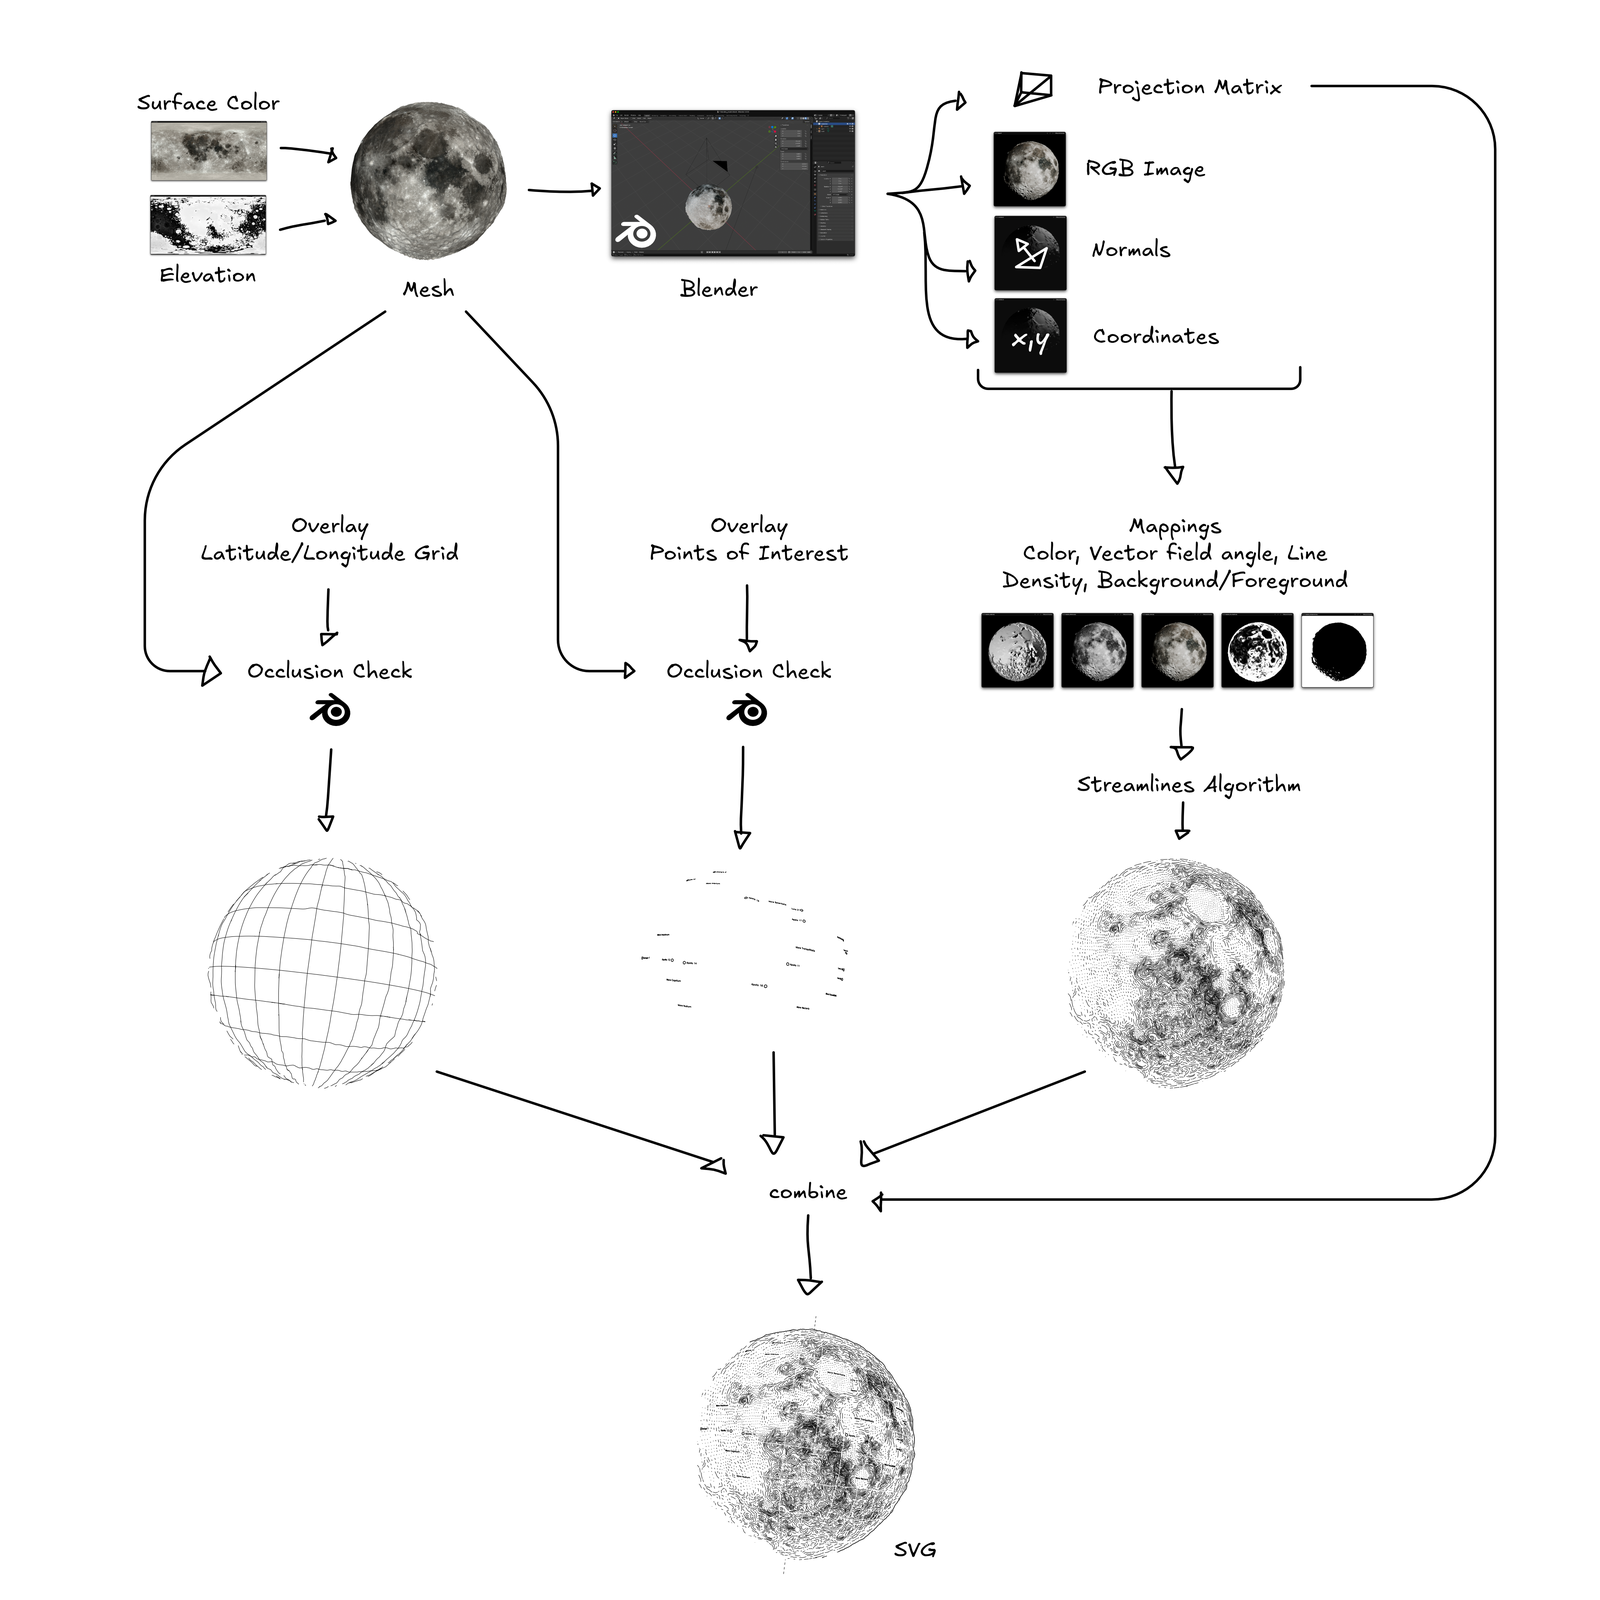
This provides the info of each image pixels color, location in 3d space and orientation of the surface at this point, so all we need to compute lines that align to this geometry.
The algorithm to place lines that conform to the surface is Jobard and Lefer’s Creating Evenly-Spaced Streamlines of Arbitrary Density from 1997. That’s probably the most commonly used algorithm for this kind of project in the generative art scene and works well with a few tweaks.
Originally I modified the streamlines algorithm to work in 3D space, following the contours of the original mesh and dropping occluded lines at a later step, but realized that dealing with lines close to the visible horizon of the planet was a major issue.
At this point it may make sense to talk explicitly about the joy and frustration of pen plotters for a moment. With pixel based images it is not an issue to overwrite pixels during computation over and over again. When generating line data for pen plotters, drawing too many lines on top of each other will absolutely lead to torn paper and very ugly images.
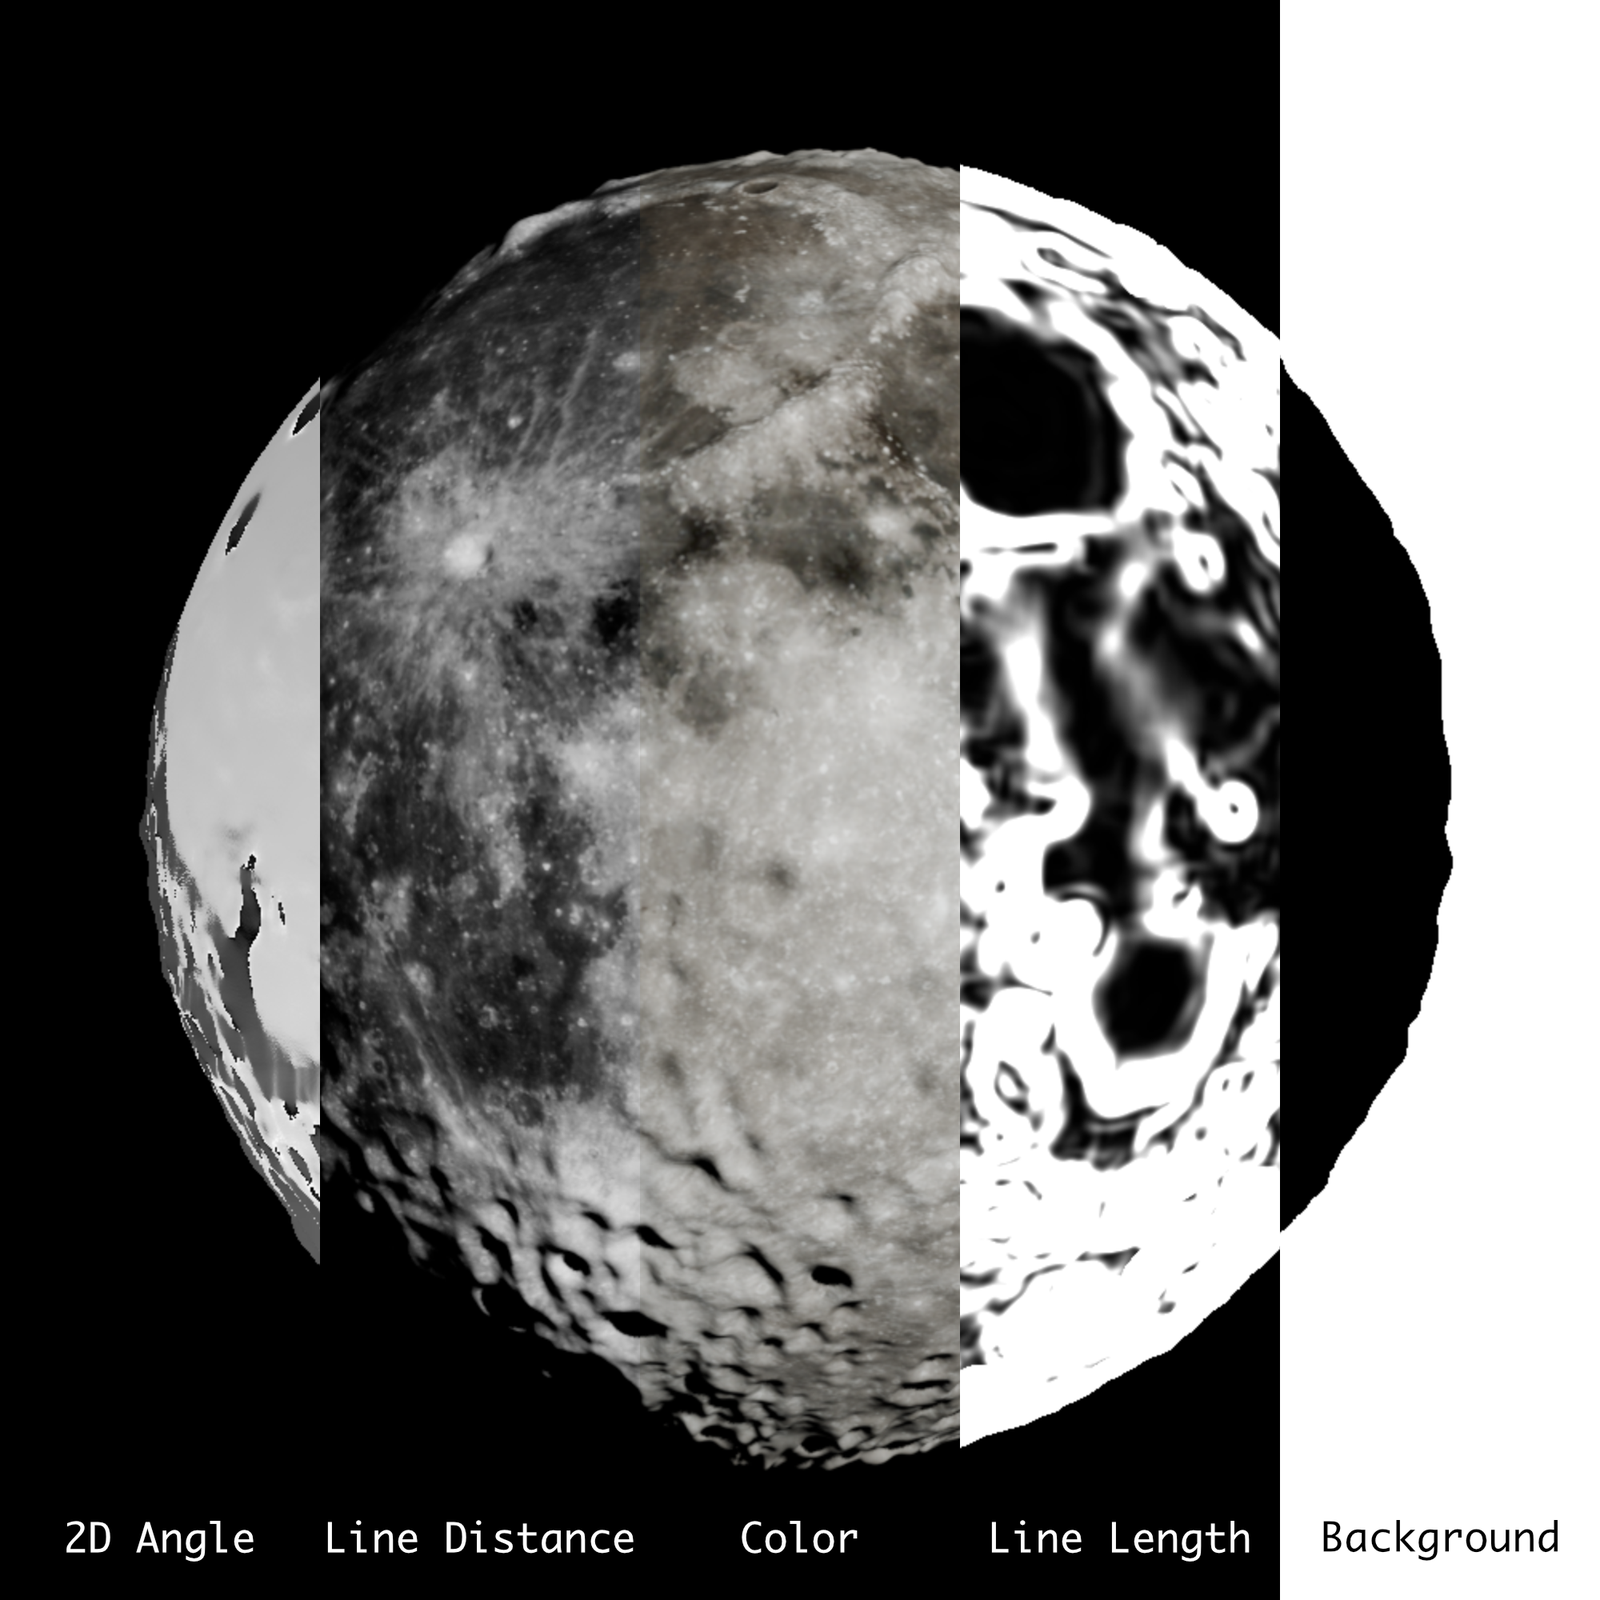
So what I do is computing a vector field in 2D that should conform to the perceived shape of the mesh from the viewpoint of the camera in Blender. On this field then (in 2D) the streamlines are placed.
The most important (artistic) decision is how the flow field should relate to light and surface shape, i.e. to what extent should the direction of a line be influenced by the position/angle of the light source or the angle of the surface it depicts in relation to the overall shape. Example:
After a lot of experimenting I settled on a mixture:
- In flat areas, lines align with the shape of the surface but run perpendicular to the direction of the light source.
- In areas with a steep incline, the line runs perpendicular to the slope of the incline, similar to contour lines for hills and valleys on maps.
- The areas in between both are a linear combination of both directions.
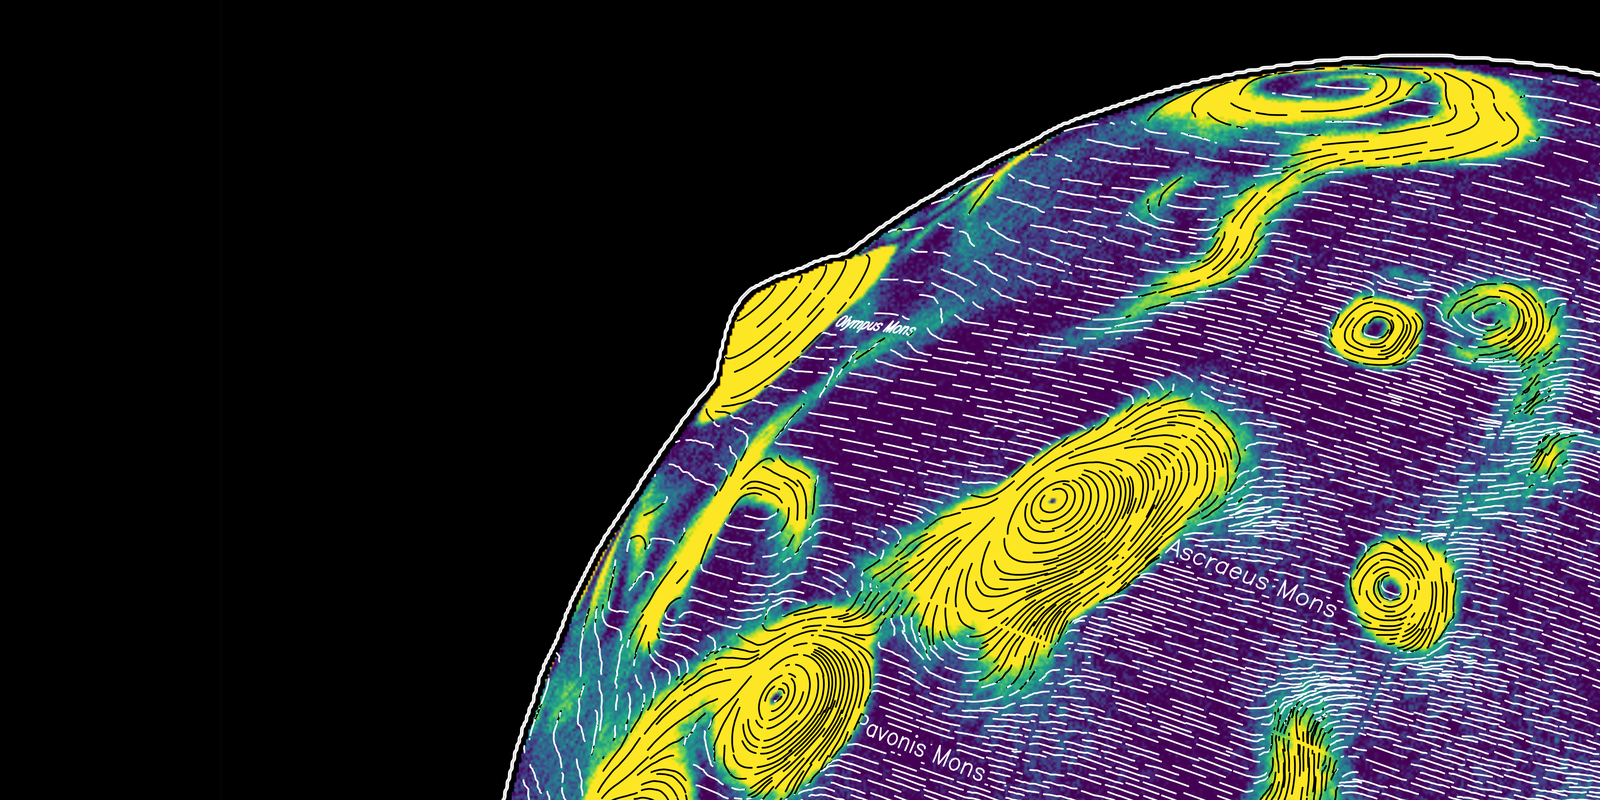
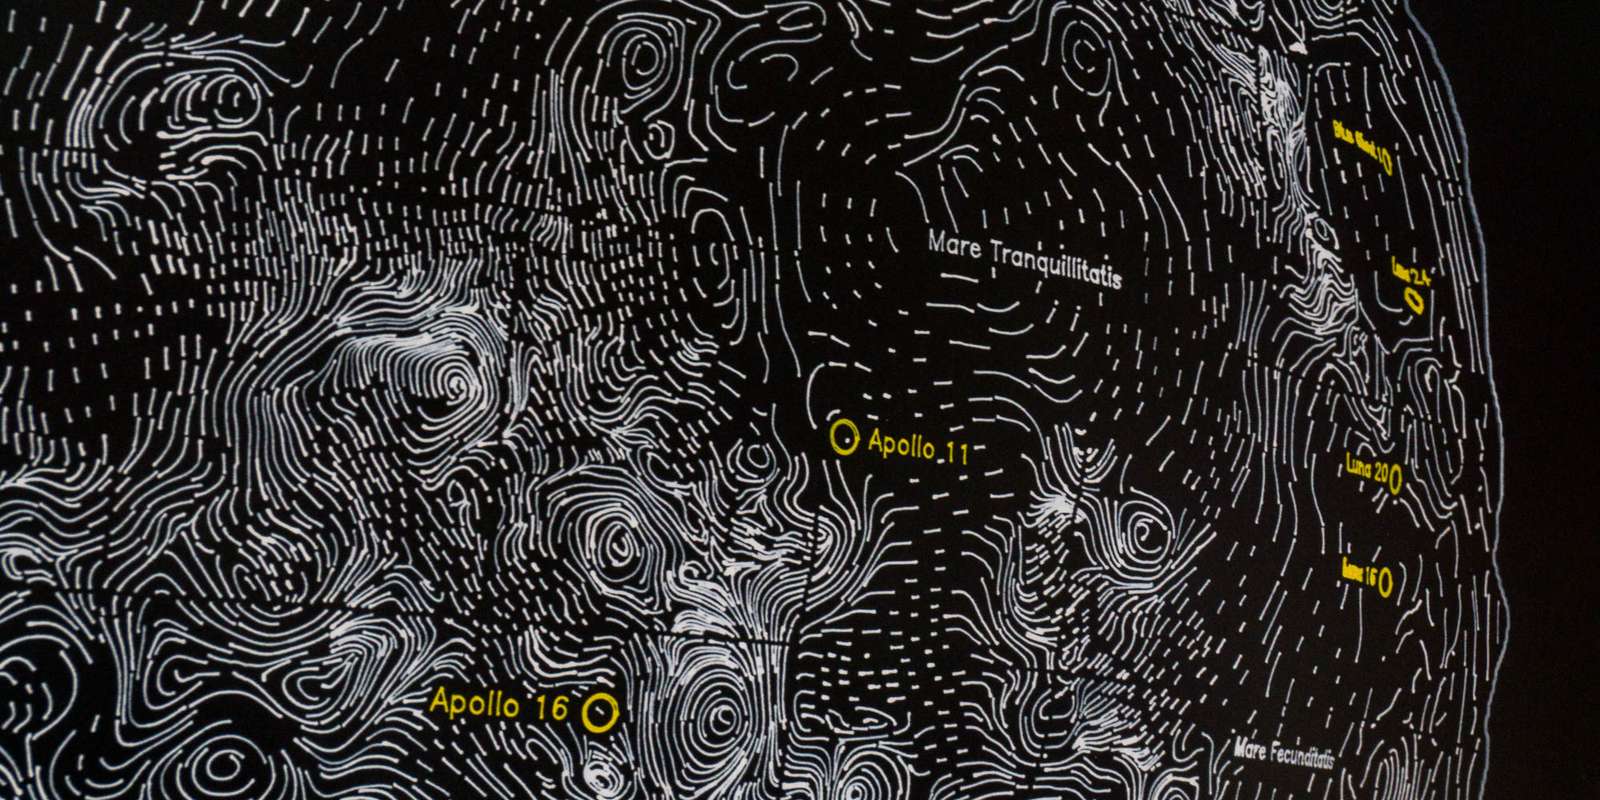
Using the projection matrix exported from Blender, additional layers (such as points of interest like spacecraft landing sites on the Moon, latitude and longitude lines and the tilt axis) can be converted from world space into image space and overlaid onto the image. Text is drawn using Hershey fonts based on the excellent Hershey Text Plugin by Evil Mad Scientist.
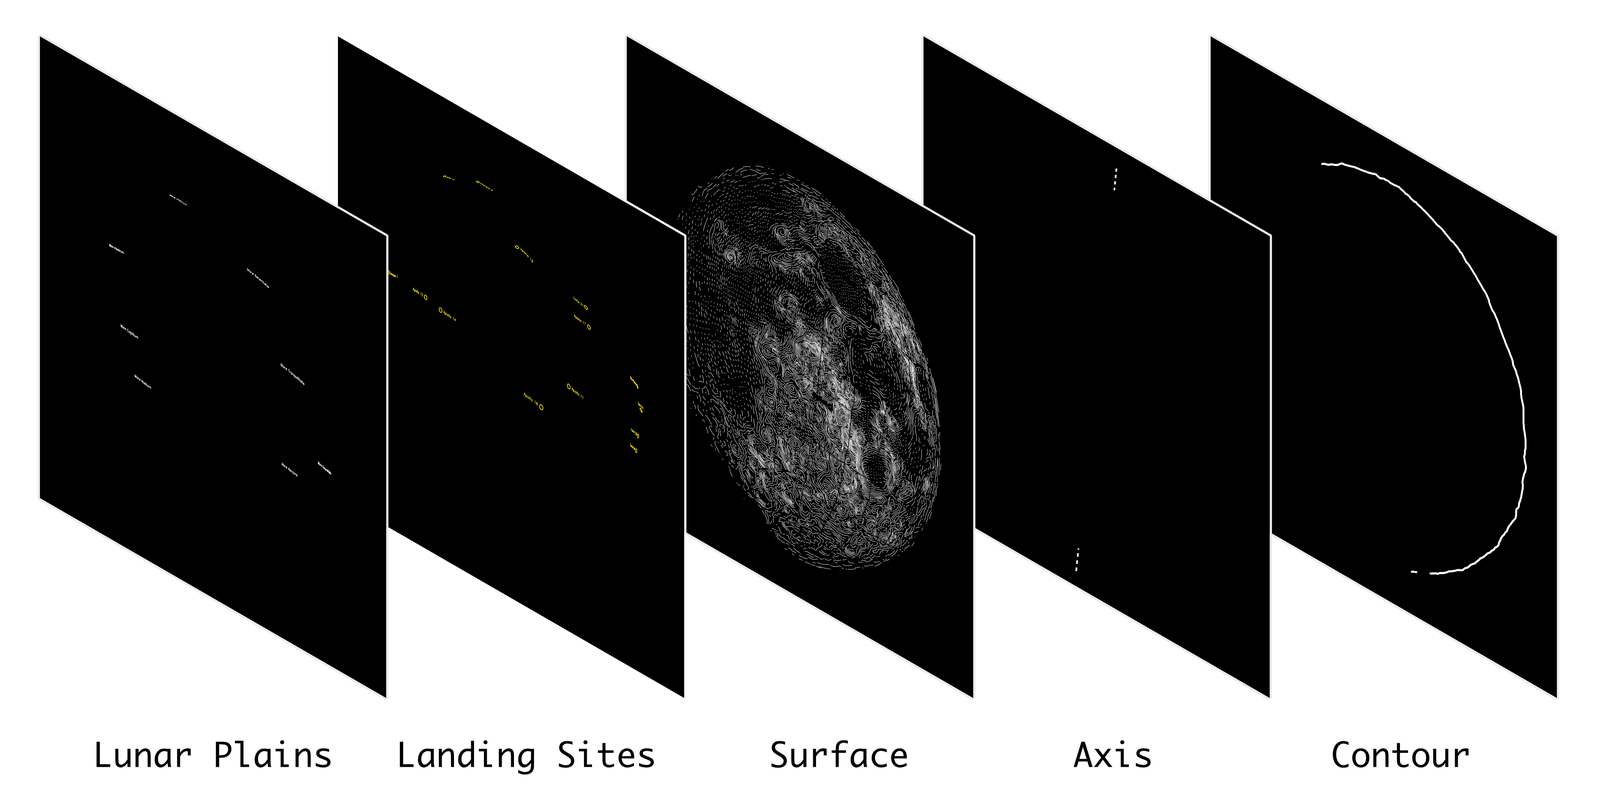
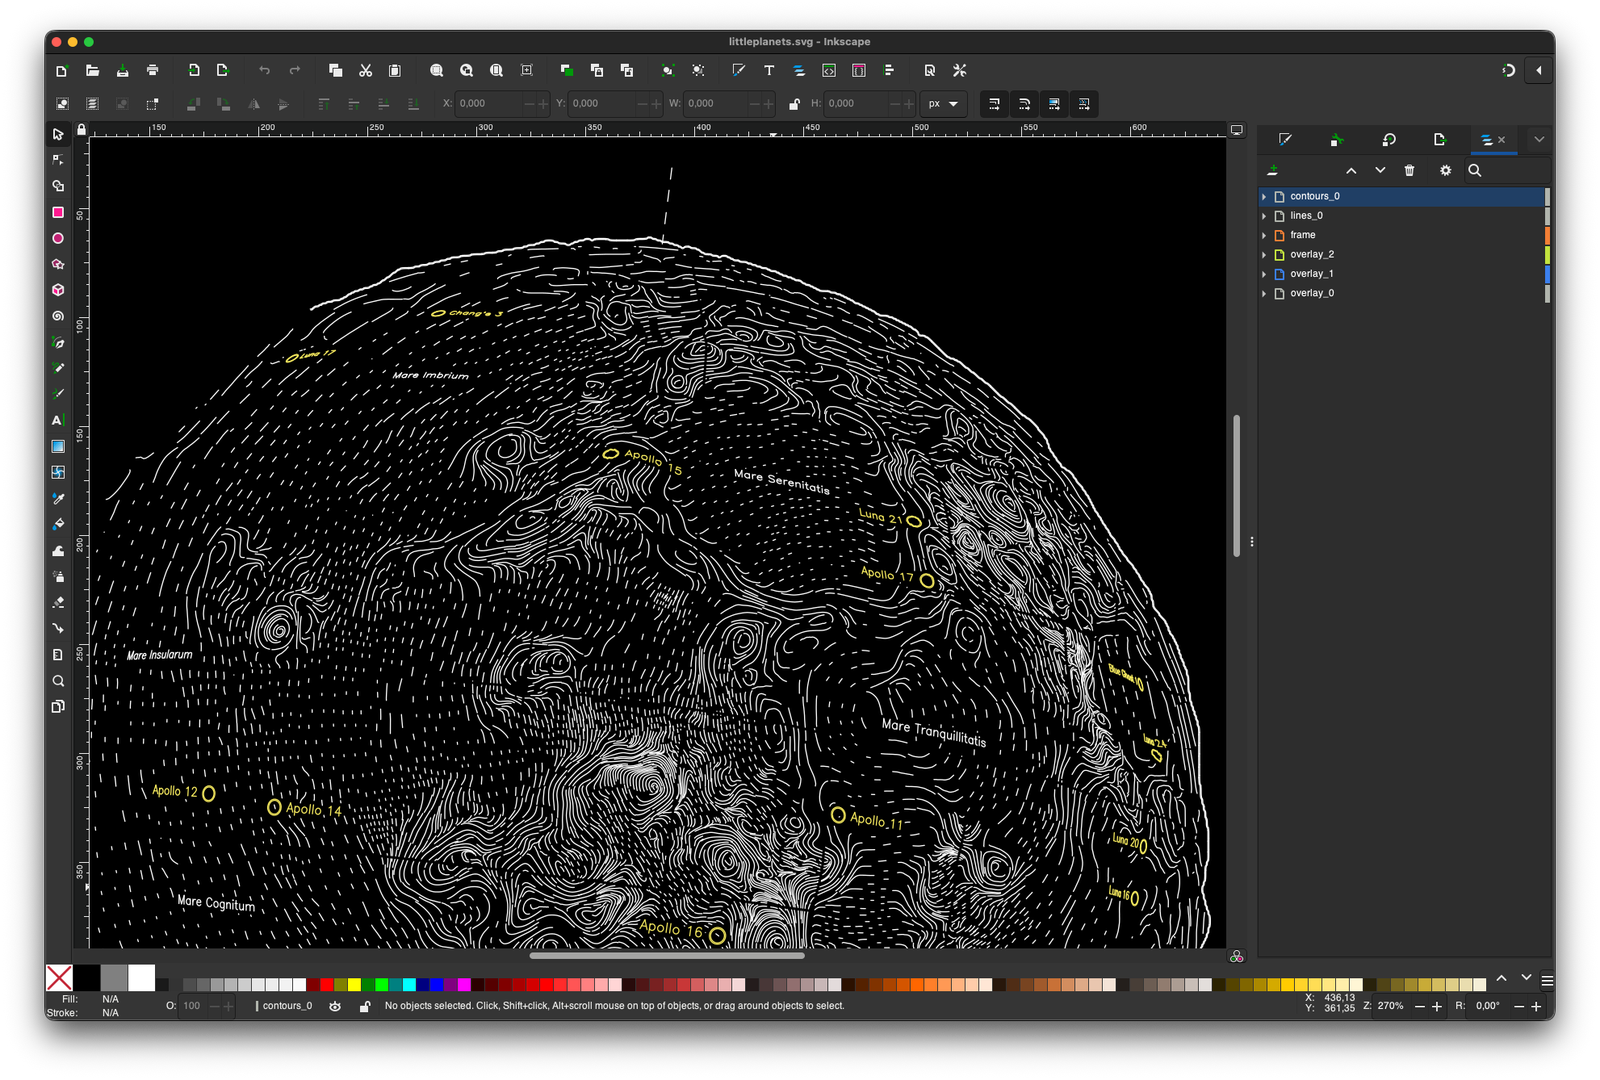
In the very last processing step, each layer is used as a cutout for all layers below to ensure no two lines will ever cross. The resulting paths are then exported to a SVG file. Comes in very handy for visualization and debugging. I am using a simple python script to convert all of these lines to GCODE commands for my DIY pen plotter.
Nib and Ink Choice
Drawing a large number of thin and opaque lines on black paper is hard. Many ballpoint pens or ink pens struggle to either achieve a 100% opacity. Pentel gel markers work well and are thin (0.4mm), but are not refillable and very expensive. Refillable pens are cheap, but thick (>1.0mm).
The most economical choice for putting a lot of lines on paper is a fountain pen with a fountain pen nib. But those work with capillary action and require fountain pen ink. In this case, the color pigments are water-soluble so they won’t clog the fountain pens delicate inner structures. This ink is not opaque enough to work well (or at all) on black paper, in contrast to ink that uses non-soluble pigments (also called chinese ink).
Refillable markers on the other hand, work well with acrylic paints containing such a high number of pigment particles that they cover black paper well, but are too thick.
What worked well for me in the end, are dip pens. A nib is dipped into a reservoir of paint, a small amount of ink clings to the surface of the metal and it flows to the top of the nib.
This is pretty slow and slightly more inconvenient that fountain pens or marker pens, but allows me to use any paint or ink. I am pretty happy with the Aero Color Total Cover acrylic paints by the german company Schmincke:
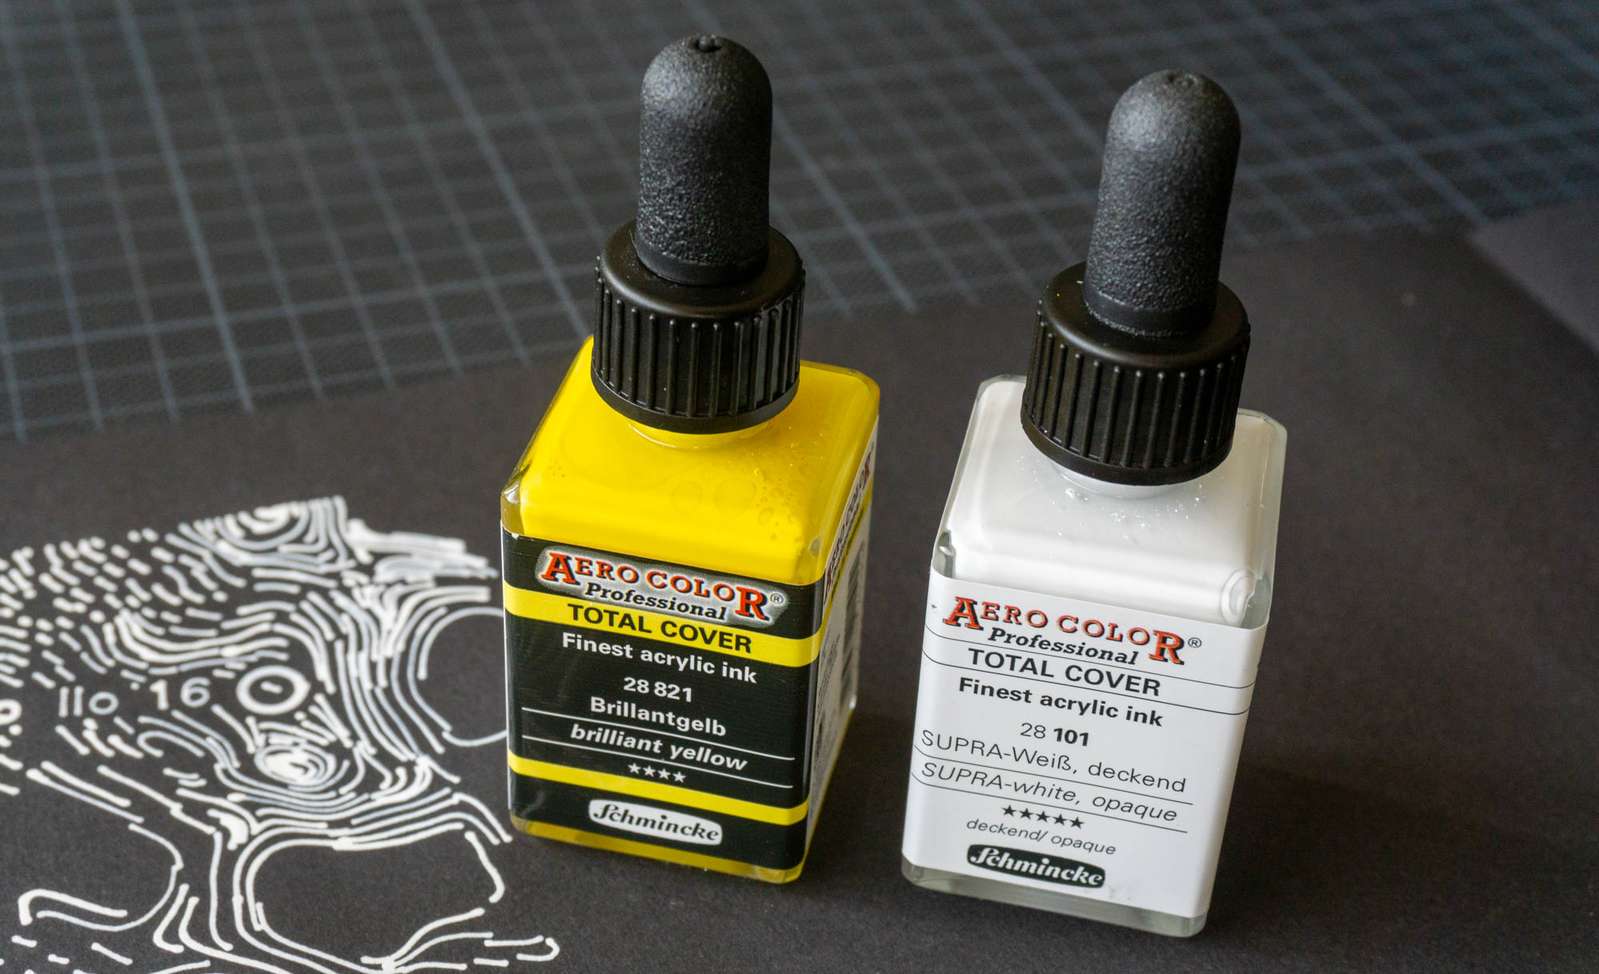
There is a decent selection of colors, those marked as “total cover” do indeed cover the underground completely. Most of the paints can be used with thin nibs (>=0.4mm) and prices are reasonable (~10€ for the small bottles).
Finding the perfect nib was a lot more complicated. Dip pen nibs are usually used for calligraphy and are intended to be pulled, not pushed. I had little interest adding the logic to my line processing code to account for the orientation of the line and looked for nibs that work well no matter how the pen plotter is moving them across the paper.
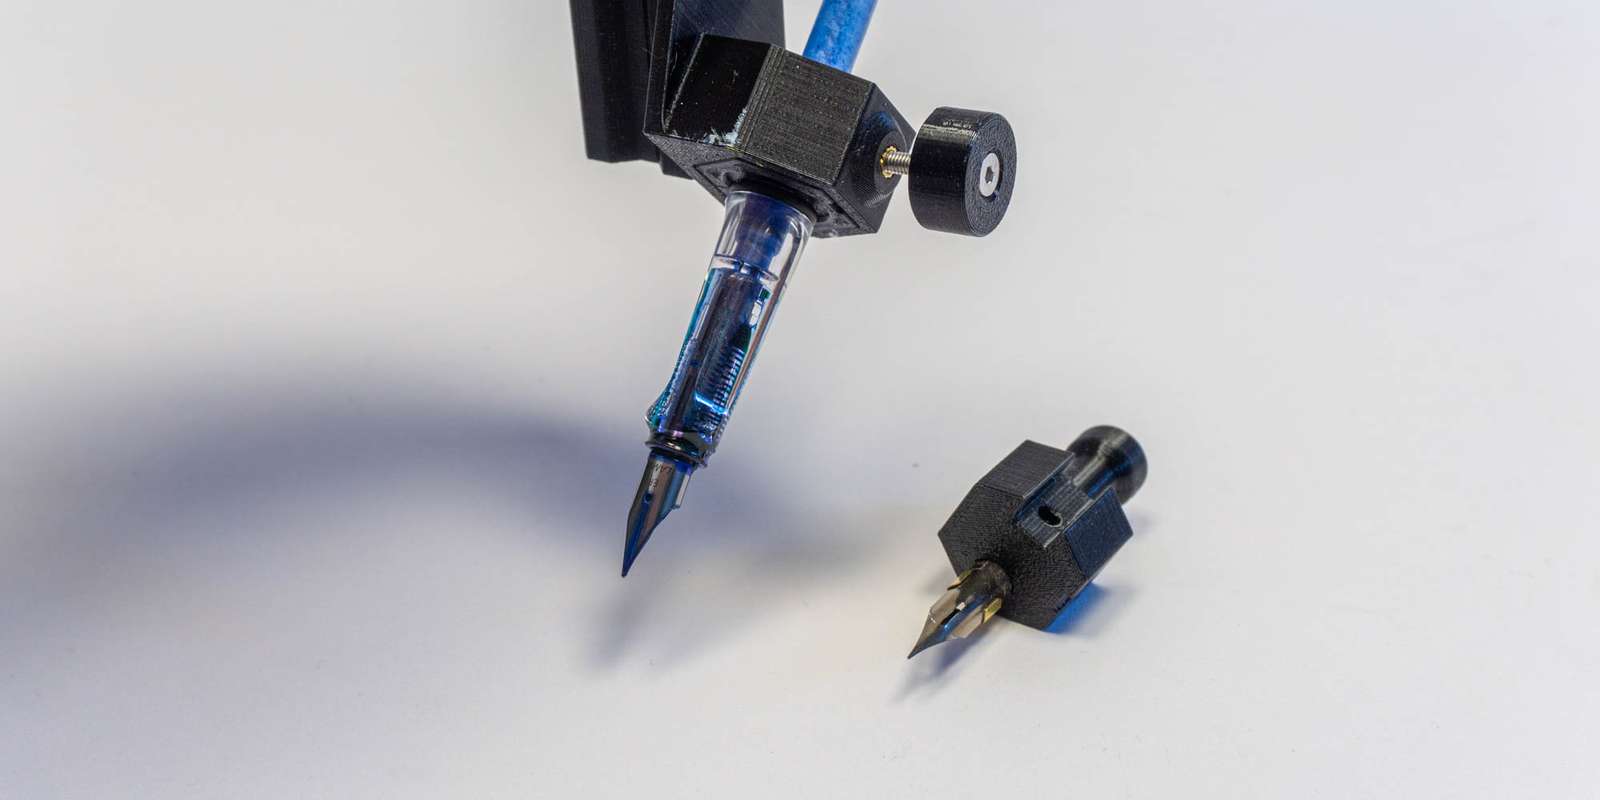
I tested about a dozen and settled on the Hiro Leonardt 256, mounted in a 3d-printed adapter for the pen carriage of my pen plotter. It was important to keep the weight as low as possible so gravity won’t apply too much force on the nib. A plus of the printed holder to have an easy way to remove and clean the nib2.
Having the rough outlines for the generation pipeline and a way to put these on paper reliably, I still need to do the parameter finetuning, define how the light should fall and so on. That’s basically where the hard part begun. But let me go on a tangent:
How to work with generative algorithms
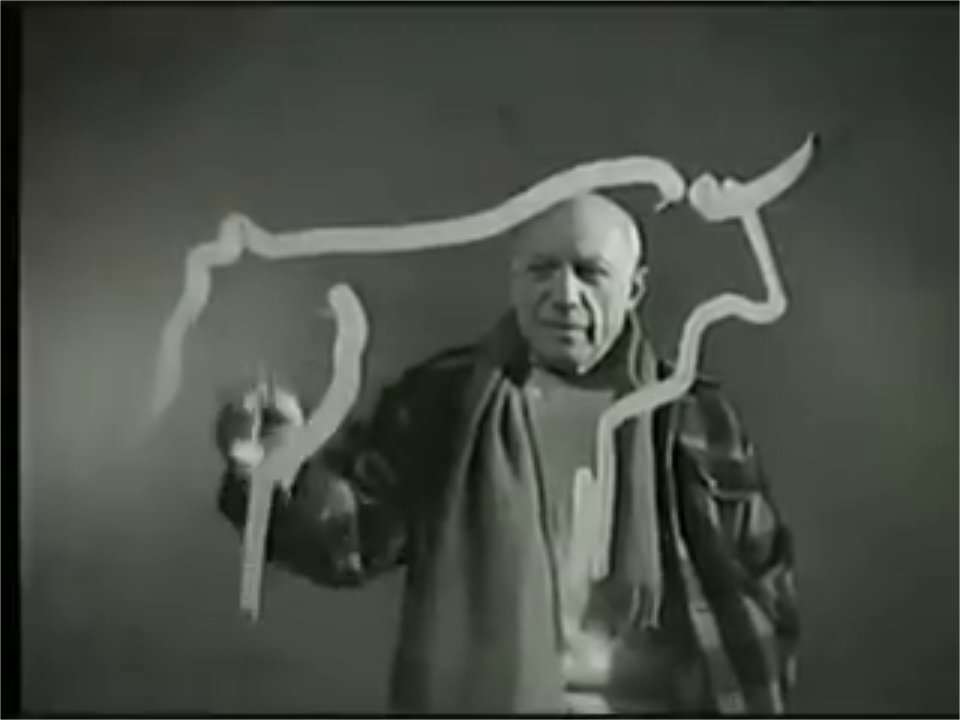
A statement I come back to again and again is “art is about making choices”3. Not always “What do I want to convey?” but more like “What pleases my eye?”. Often this involves a lot of trial and error, ideally with a tight feedback loop. Draw a line, observe if it appeals, erase it or continue.
A generative algorithm might behave in the same way like a brush, if the gap between intention and output is not too extreme. A very small difference results in brushstrokes exactly as intended with no variation. A larger difference may yield “happy little accidents” you enjoy. A very large difference may be abstract paint splashes that can not be controlled or repeated by the artist. In this case, the “artistic intention” can only happen in the act of selecting a pleasing random output from a lot of paint-splashing sessions. This may be proper behaviour for artists. Pollock would probably claim so. (Some) people prompting Generative AI models certainly do claim this.
I, however, do not claim to make art. I enjoy working with code and physical machines that impose limitations (inkjet printers killed professional pen plotters for a reason). These machines appeal to me because one can produce visually pleasing results with them, not despite but due to their limitations. I make decoration. But nevertheless, I want to steer this process as close as necessary and as random as suitable to have fun and get results I am happy with.
My rendering pipeline makes use of a large number of variables (how much should the mountains be exaggerated in the mesh?, how long or how close should the lines be drawn in the image?, etc.). All of these variables are managed in a single configuration file that can be altered by a separate piece of software that allows me to create a few hundred examples in a single run to compare how changing one or several variables in combination would change the output. Because running the whole pipeline is quite computationally expensive, only the necessary steps are re-run depending on the variable that changed. To be able to meaningfully steer this process, the feedback loops needs to be as close as possible. You won’t enjoy drawing a line with your brush if the canvas loads for 90s till the paint shows up.
The second dimension of this work is the work on the tool itself. You don’t need to mix your own pigments or make your own brush to create a painting. But sometimes, making the utensils is part of the process. When changing the variables does yield results I am satisfied with, I go up one rung on the ladder and change the code. This is considerably slower, but part of the work with generative algorithms. The question I pondered while spending way to much time going back and forth between changing variables and changing code is, if I can benefit in any way from generating the code I am working on. Relying for the code itself on a process of “prompt in -> (partly) random result out -> selecting candidate”.
This absolutely did not work for me. Working with generative algorithms is about putting reigns on the randomness. Not too much, not too little, not at the wrong place. I observed for me that the act of generating code creates a distance, one might even say some amount of alienation, to what I produce. This is not an issue in general, for example, I generated a visualization tool to compare large amounts of output images and the corresponding sets of variables4. But the code to generate the image itself, is something I felt I need to keep close, otherwise I do not enjoy the feedback loop. A brush I made for myself (that allowed me to learn in the process of making it a lot about 3d-geometry and basic rendering), not a randomizing paint flinger.
Your results may vary. For me, this was an interesting insight.
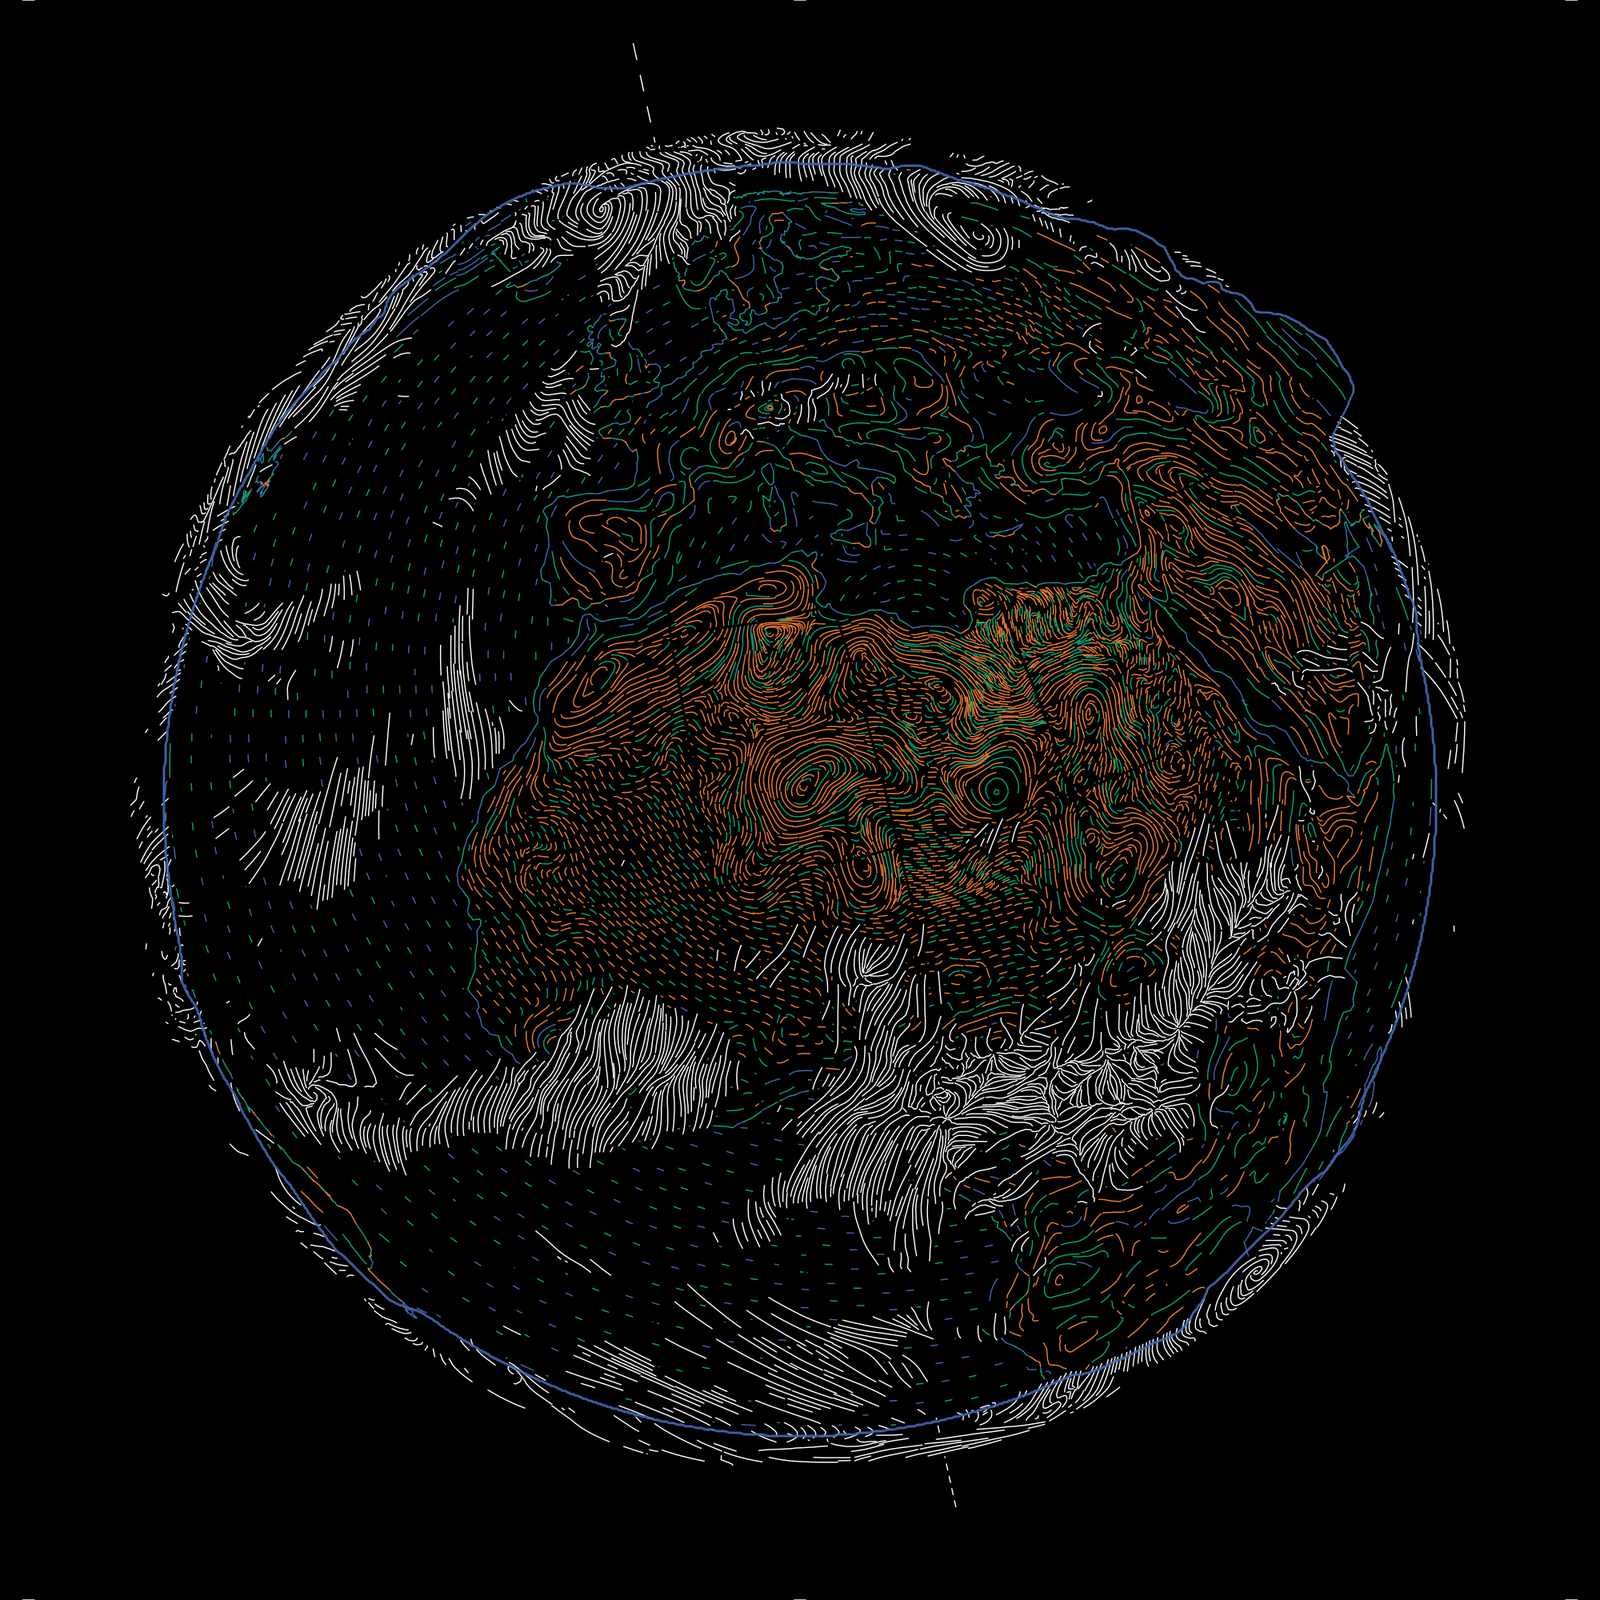
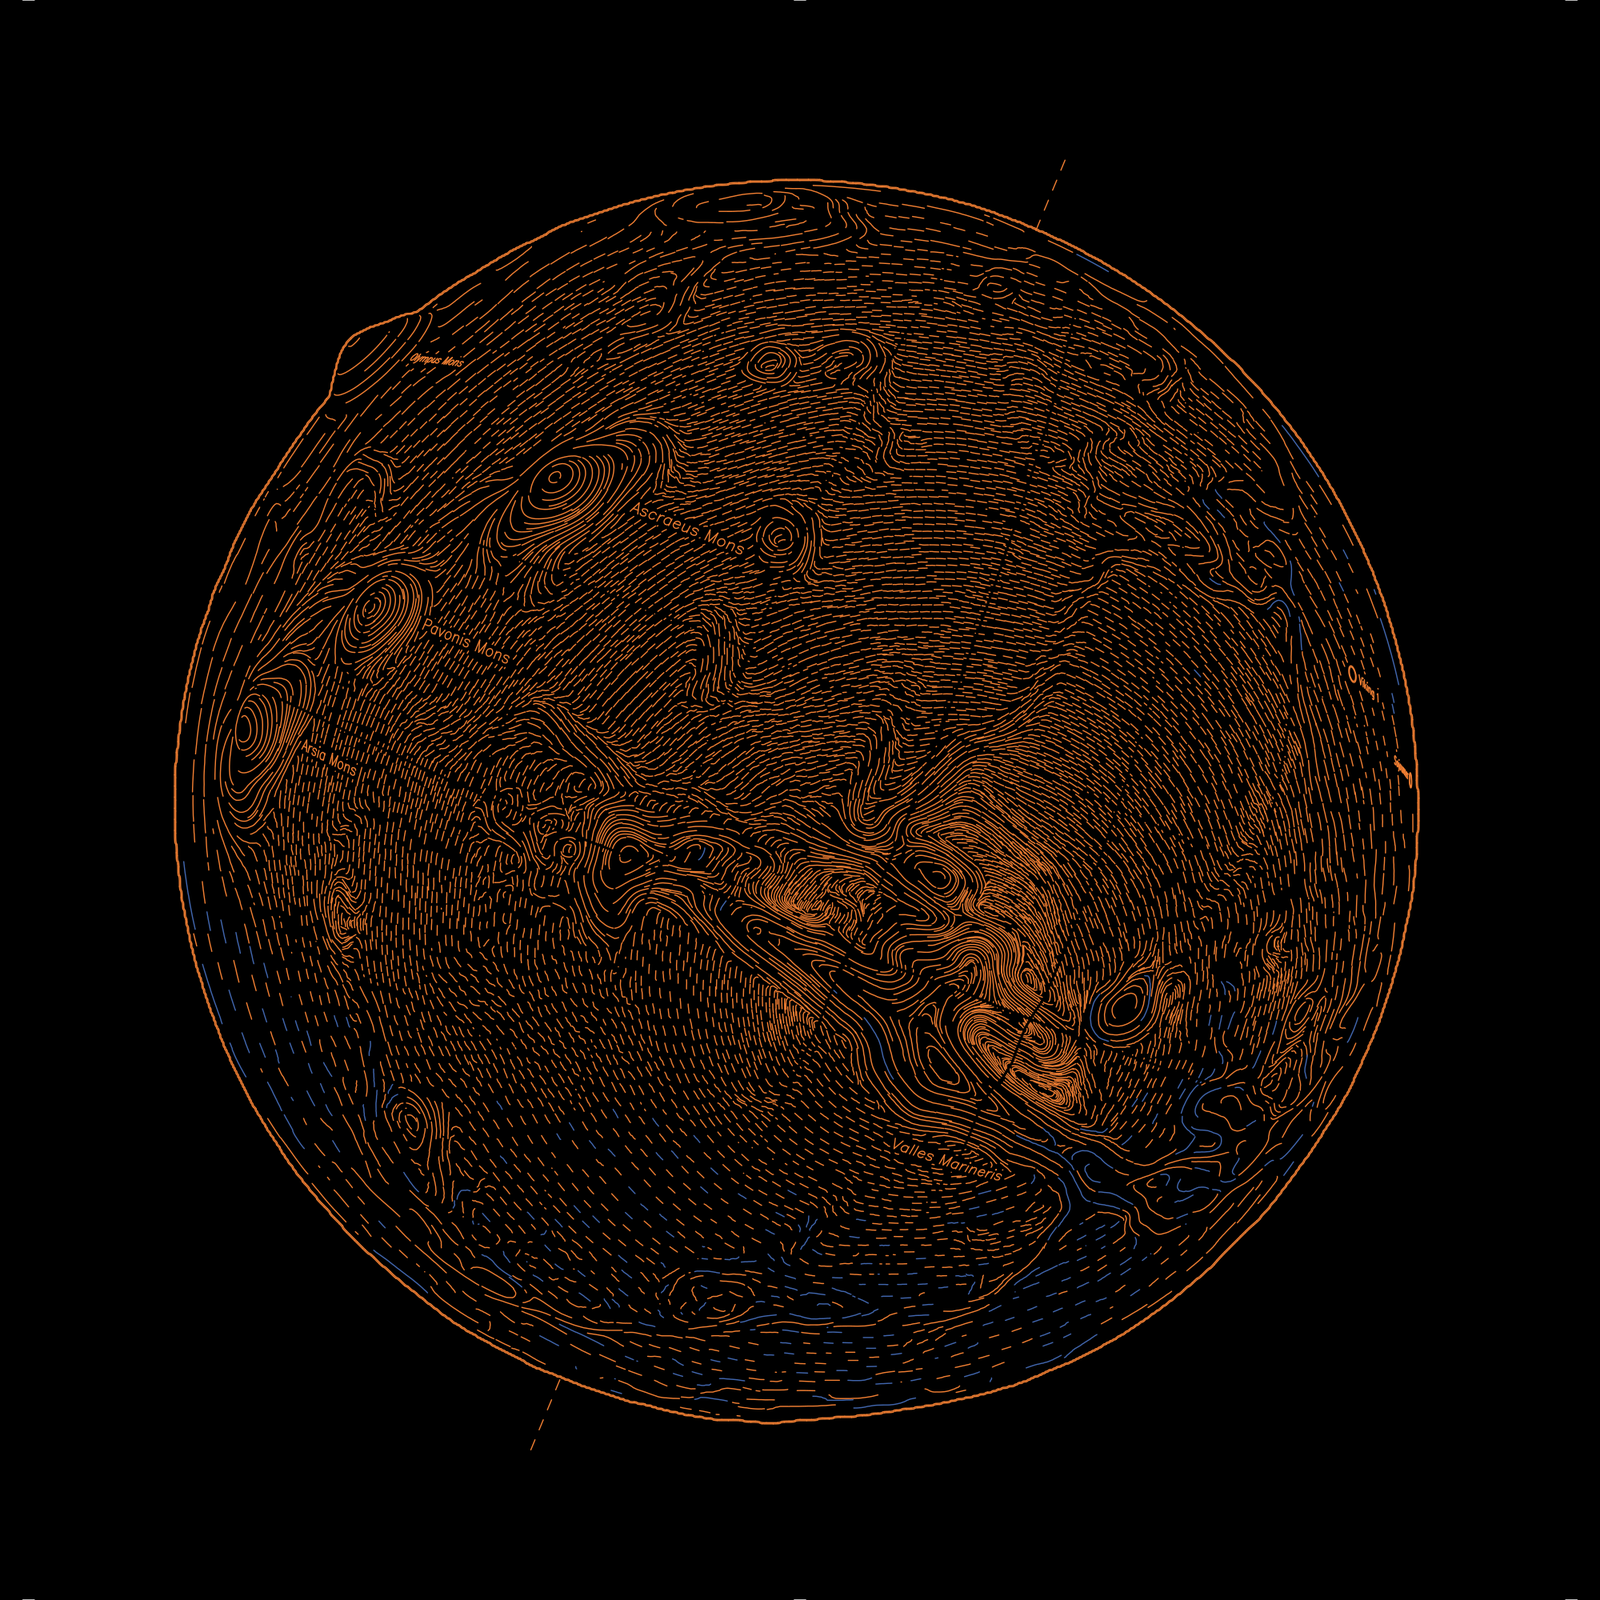
I plotted the Moon for now, the rest will follow:
Related Work
- in r/generative on reddit, mediocre-mind2 did something similar in a very visually pleasing way by computing lines in image space and drawing them with Blender’s Grease Pencil
Code
-
Drawing all the lines for a littleplanet takes about 4 to 5 hours. During this time the nib needs to be cleaned a dozen times to remove dried acrylic paint buildup. ↩
-
Aaron Hertzmann, co-author of several of the papers I recommended, did discuss this in several of his blog posts ↩
-
This is the optimal niche for code generation for me, right now: generating one-off tools with a well-defined output. ↩